A popular template tells you to pick channels, set a content cadence, and review a dashboard once a month. That advice produces activity, not decisions. It never forces you to name who you won't sell to, which alternative you replace, or how many wins the bookings target requires.
A B2B marketing plan template should be a revenue decision document. Work backward from bookings to the leads you must create, then write the rule that says when a channel stays, changes, or stops. If a section can't change a decision, it doesn't belong in the file.
Founders reach for the calendar because empty weeks look like neglect. The expensive failure is the opposite. You fund three channels for a quarter, then find that sales won't accept the leads, the buying group was never mapped, and nobody agreed what qualified means. Settle the document before you touch the ads.
A channel calendar is not a plan. It schedules work without deciding who buys, why they choose you, or what revenue has to happen for the spend to be justified. Teams that start there spend the quarter arguing LinkedIn against Google Ads while the customer definition is still a slide from last year's deck.
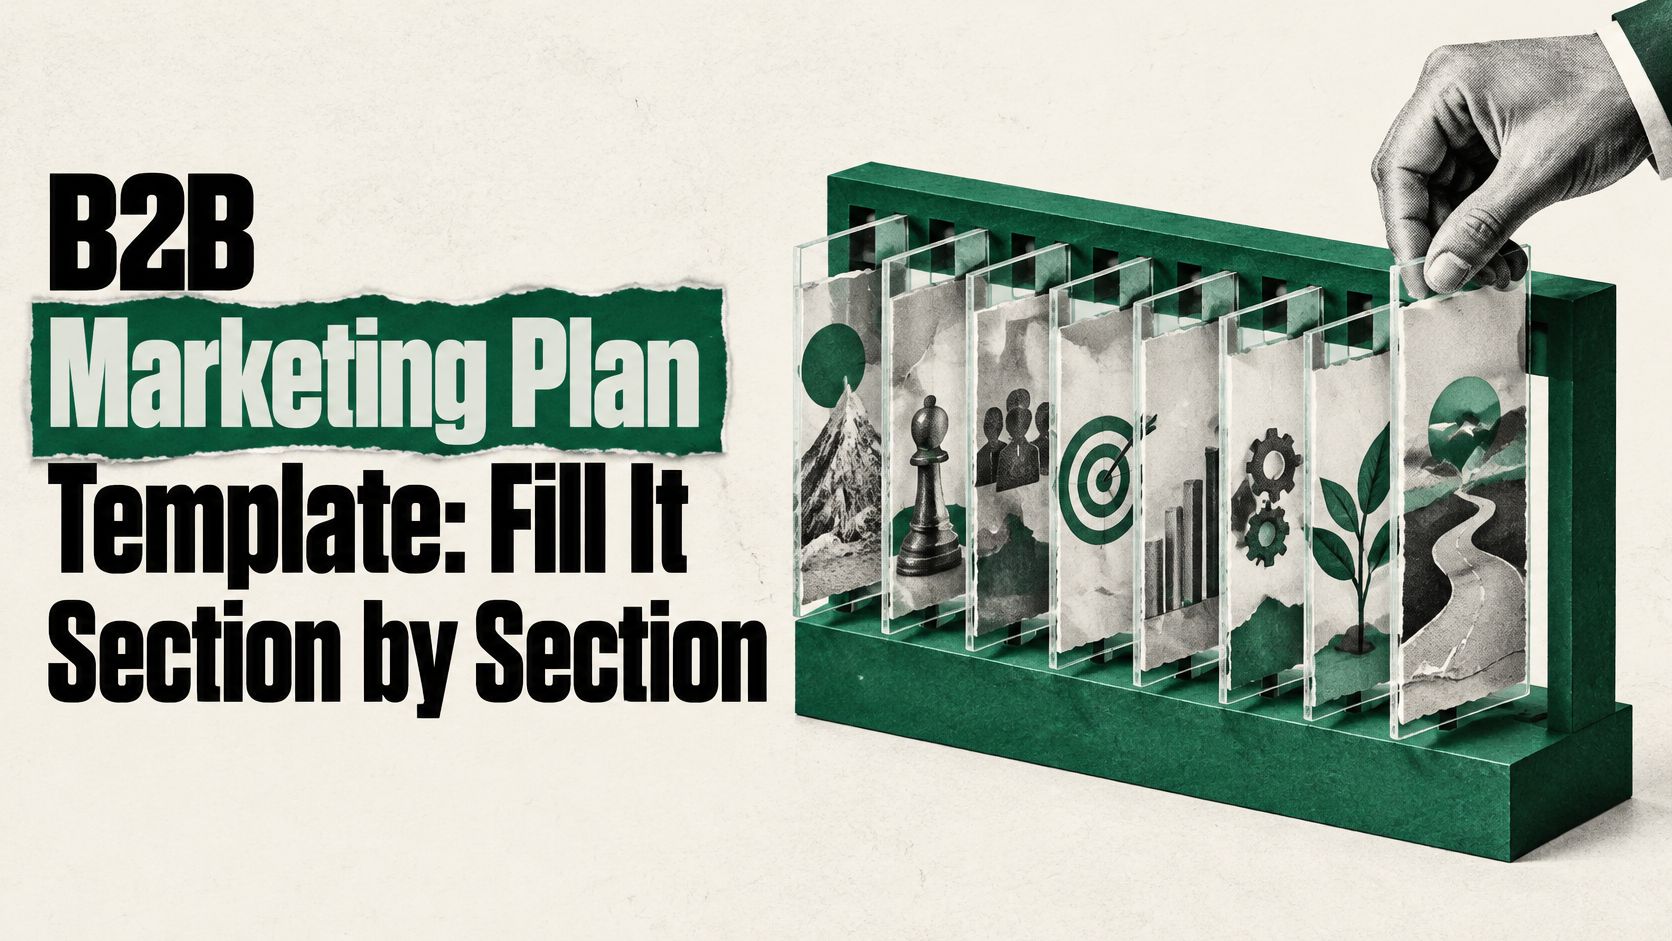
Use eight sections. Each one has one required output, one owner, and a date. Nothing gets booked until those cells are filled.
| Plan section | Question it answers | Required output | Owner |
|---|---|---|---|
| Market context | Who we serve and who we decline | ICP, buying committee roles, excluded segments | CEO or CMO |
| Positioning | Why buyers pick us over the alternative | Positioning statement, named alternatives, proof points | CMO |
| Goals and KPIs | What revenue must happen | Reverse revenue model with stage targets | Revenue lead |
| Buyer journeys | How each stakeholder decides | Stage map with questions and assets per role | Marketing lead |
| Channel plans | Which channel answers which buyer question | One outcome and one asset per channel | Channel owners |
| Budget | How spend splits across goals | Split across brand, demand and lead generation | CFO and CMO |
| Timeline | When results become judgeable | 90-day milestones and 12-month review points | Marketing lead |
| Measurement | What counts as evidence | Metric definitions, data sources, decision rules | RevOps or analytics owner |
Market context names the ideal customer, the buying committee, and the segments you refuse. Positioning names the alternative you replace, often a spreadsheet or an internal build, plus the proof that makes the claim believable. Goals and KPIs turn a bookings target into stage counts. Buyer journeys list the question each stakeholder asks. Channel plans give each channel one of those questions and one measurable outcome. Budget separates brand, demand, and lead generation. Timeline sets when a result can fairly be judged. Measurement states the evidence rule and the decision that result triggers.
Practical rule: Copy this table into one shared document before any channel is booked. One person owns the file. Every number names its source, whether that's CRM history or a stated planning assumption.
Blank cells are unfinished decisions, not items for a kickoff. If nobody can change a row, that row will be ignored the week a campaign misses.
Fill the sections in order. Later pages inherit the mistakes of earlier ones, and channels are the last inheritance, not the first.
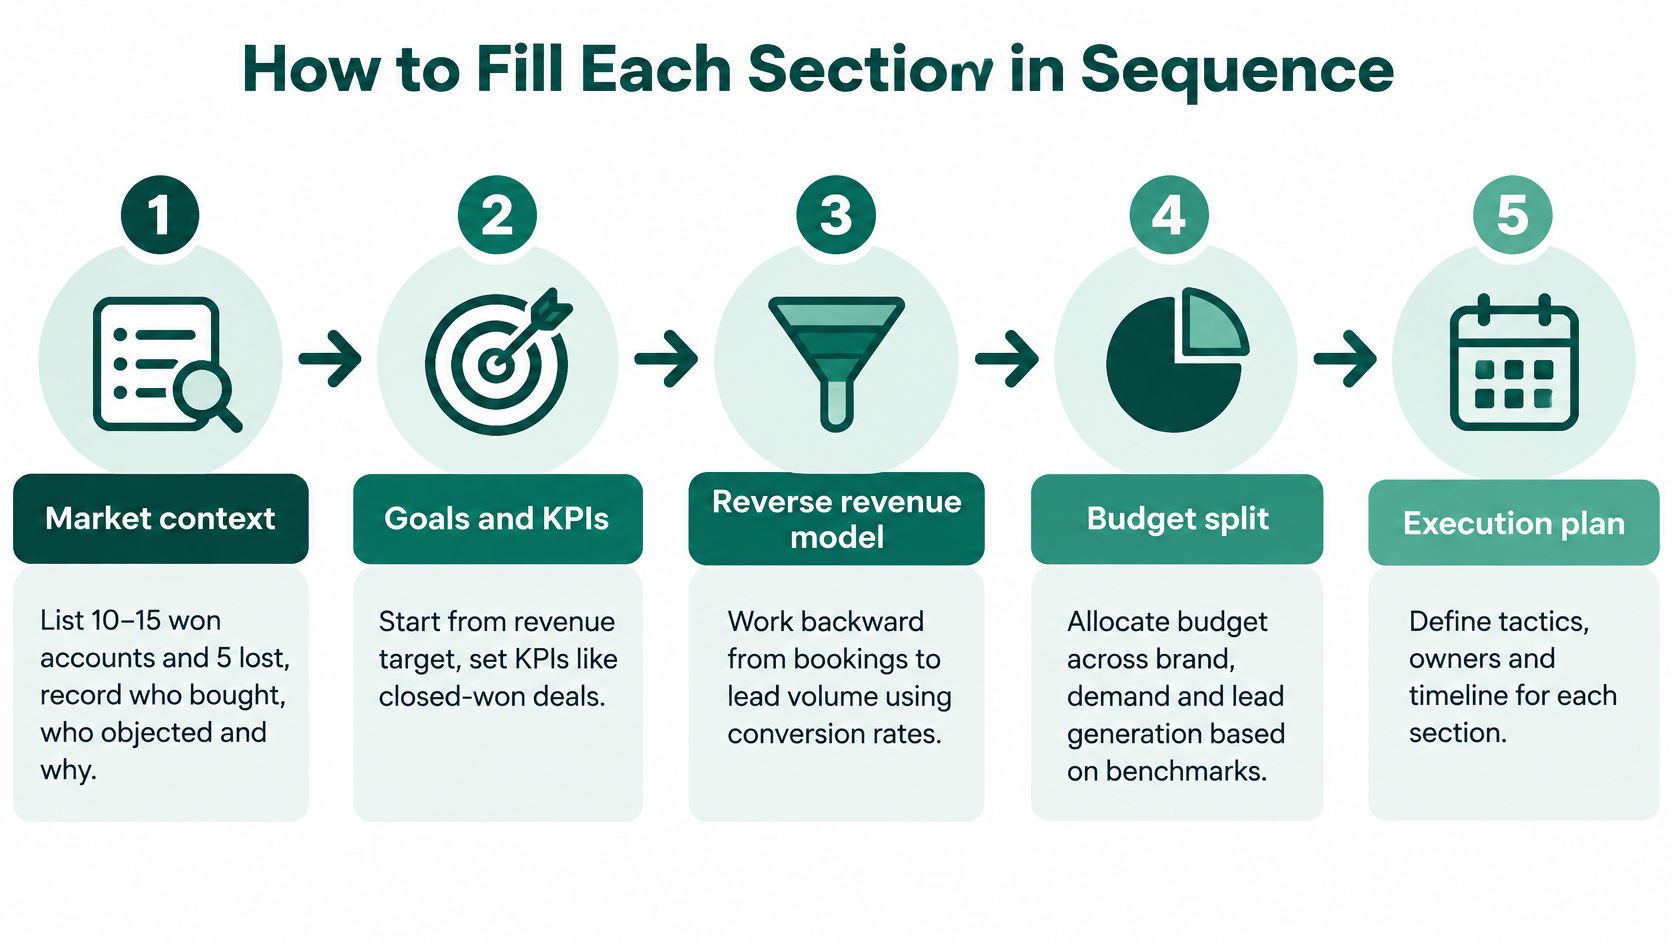
1. Market context. Input is 10 to 15 accounts you won and 5 you lost, with who bought, who objected, and why. The decision is who you will not serve. The common error is a persona workshop that invents a buyer who has never appeared on a closed deal.
2. Positioning. Write the statement as a comparison against a named alternative: a competitor, a spreadsheet, or an internal build. Test it with three customers and keep their words when they're sharper than yours. The error is a category slogan nobody can repeat in a buying meeting.
3. Buying group, then journeys. Name who discovers the problem, who checks technical fit, who judges commercial risk, who approves budget, and who validates the choice inside the account. Forrester's Buyer Insights research, based on more than 17,500 global business and technology buyers, maps those roles across discovery, evaluation, decision, and validation. A SaaS purchase is rarely one person's call. The error is writing every asset for the single friendly champion.
4. Goals. Build targets from the bookings the business needs, not from last quarter's lead total. The error is a lead goal that still misses the revenue number even if every stage converts at your best historical rate.
5. Channels last. A channel earns a line only when it answers one buyer question at one stage. The error is filling weeks because an empty calendar feels negligent. Search, LinkedIn, email, events, and partner motions are tools. They are not the plan.
6. Budget and timeline in the same pass. Separate brand, demand, and lead generation, and write the date each line is judged. A 90-day read and a 12-month read answer different questions. Mixing them is how good brand work gets killed and bad pipeline work gets extended.
7. Measurement rules before launch. Lifecycle definitions, required CRM fields, and the decision a result triggers go in before spend does. The error is agreeing the scoreboard after the money is gone.
Finish on one page. Every channel traces to a buyer question, a stage, and a revenue outcome, or it comes out of the plan.
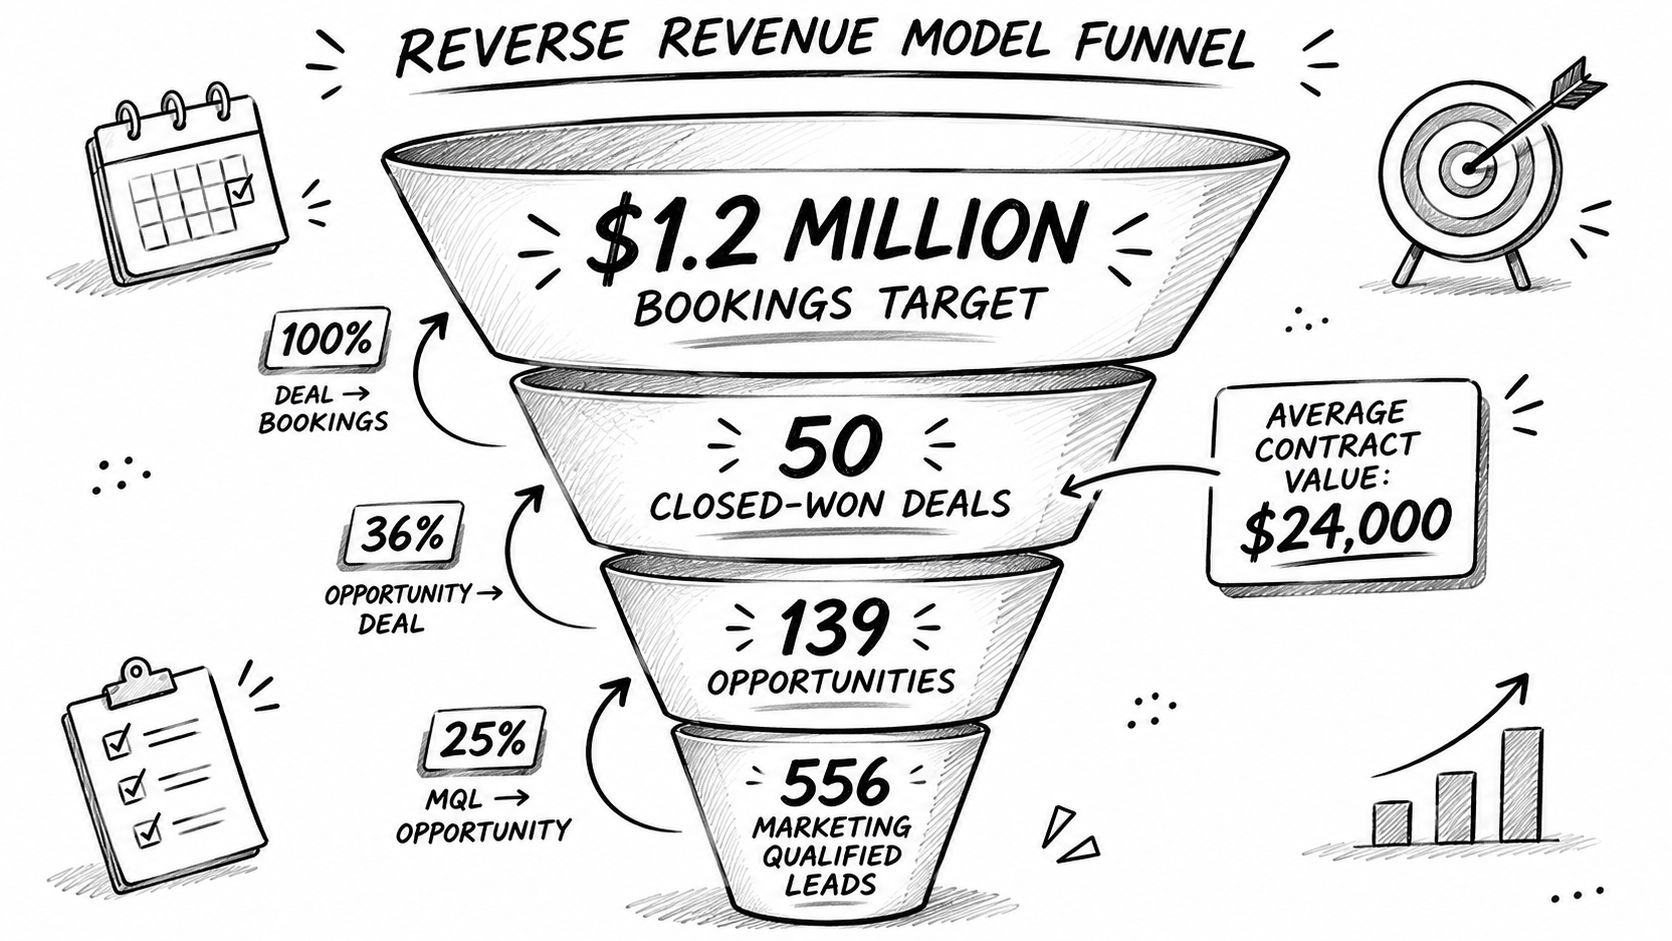
Start from revenue, not from a lead target someone picked because it sounded ambitious. Say the company needs $1.2 million in bookings and the average contract is $24,000. That is 50 closed-won deals. Nothing else in the plan is real until those 50 wins are translated into earlier-stage volume.
A synthesis of Norwest's survey of 177 sales and marketing leaders reported median conversions of 36% lead-to-SQL, 40% SQL-to-opportunity, 42% opportunity-to-proposal, and 45% proposal-to-win. Walked backward, 50 wins need about 111 proposals, 265 opportunities, 661 SQLs, and 1,837 leads. Compounded, those rates produce roughly one customer per 37 initial leads. Test that ratio against your closed cohorts before you hire or buy media against it.
| Funnel stage | Conversion applied |
|---|---|
| Closed-won deals | 50 wins, bookings target divided by $24,000 ACV |
| Proposals | 45% proposal-to-win, about 111 proposals |
| Opportunities | 42% opportunity-to-proposal, about 265 opportunities |
| SQLs | 40% SQL-to-opportunity, about 661 SQLs |
| Leads | 36% lead-to-SQL, about 1,837 leads |
Treat every benchmark as a planning assumption, not a target you are owed. Replace each rate with your own cohort as soon as one clean quarter exists. Split new-logo and expansion funnels. A blended average hides the weak segment, which is usually the new-logo motion the board is asking about. Segment again by market, channel, deal size, and sales cycle when the volume is there. Inconsistent MQL or SQL definitions make the whole table unusable, so write entry and exit rules beside the math.
Give every stage an owner, a timeframe, a CRM field, and a review cadence. Then split the scoreboard.
The assumption to test first is proposal-to-win. It sits closest to revenue, and sales already argues about it. If your history is well under 45%, the lead requirement jumps before you buy a single click. The same backward build is what a serious revenue forecast has to survive.
Questions first. Channels only after they answer one.
The business leader, at discovery, asks whether the problem is costly enough to act on. Ship problem framing, a category page, and one number they can repeat internally. The technical evaluator asks whether the product fits the stack and passes security. Ship integration documentation, a security page, and a comparison against the named alternative. Finance asks for payback and for the downside. Ship a model with every assumption visible. The champion needs proof that peers in the same segment bought and renewed.
Write those assets for buyers who never book a call. In Gartner's survey of 632 B2B buyers, 61% preferred an overall representative-free buying experience, so evaluation and justification have to stand without a conversation. Buyers use an average of ten touchpoints across in-person, remote, and digital channels, as noted in the 2026 B2B Buyer Behavior Report, so the map should be finished before the first meeting. G2's survey of 1,100 B2B decision-makers found that 79% of B2B software buyers said AI search had changed how they conducted research. Vague pages disappear inside a summary.
Then place channels inside that map. Search and comparison pages serve evaluation, measured by qualified account visits. Account-based LinkedIn serves discovery, measured by engagement from target accounts. Reviews and partners serve validation, measured by new stakeholders appearing on opportunities. No question, no stage, no outcome, no budget. The stage method is laid out in B2B customer journey mapping.
Start from a published split, then argue with it. Don't copy it because a benchmark feels safer than a choice.
LinkedIn's 2023 global B2B marketing benchmark shows lead generation at the largest average share, 36%, brand building at 30%, and demand generation at 20%. In the same research, 7 in 10 B2B leaders said their budgets were focused on generating new business, and 85% of technology companies reported allocating budget to new business. Those three lines add to 86%. The other 14% doesn't vanish. Assign it on purpose to sales enablement, tools, or a named experiment.
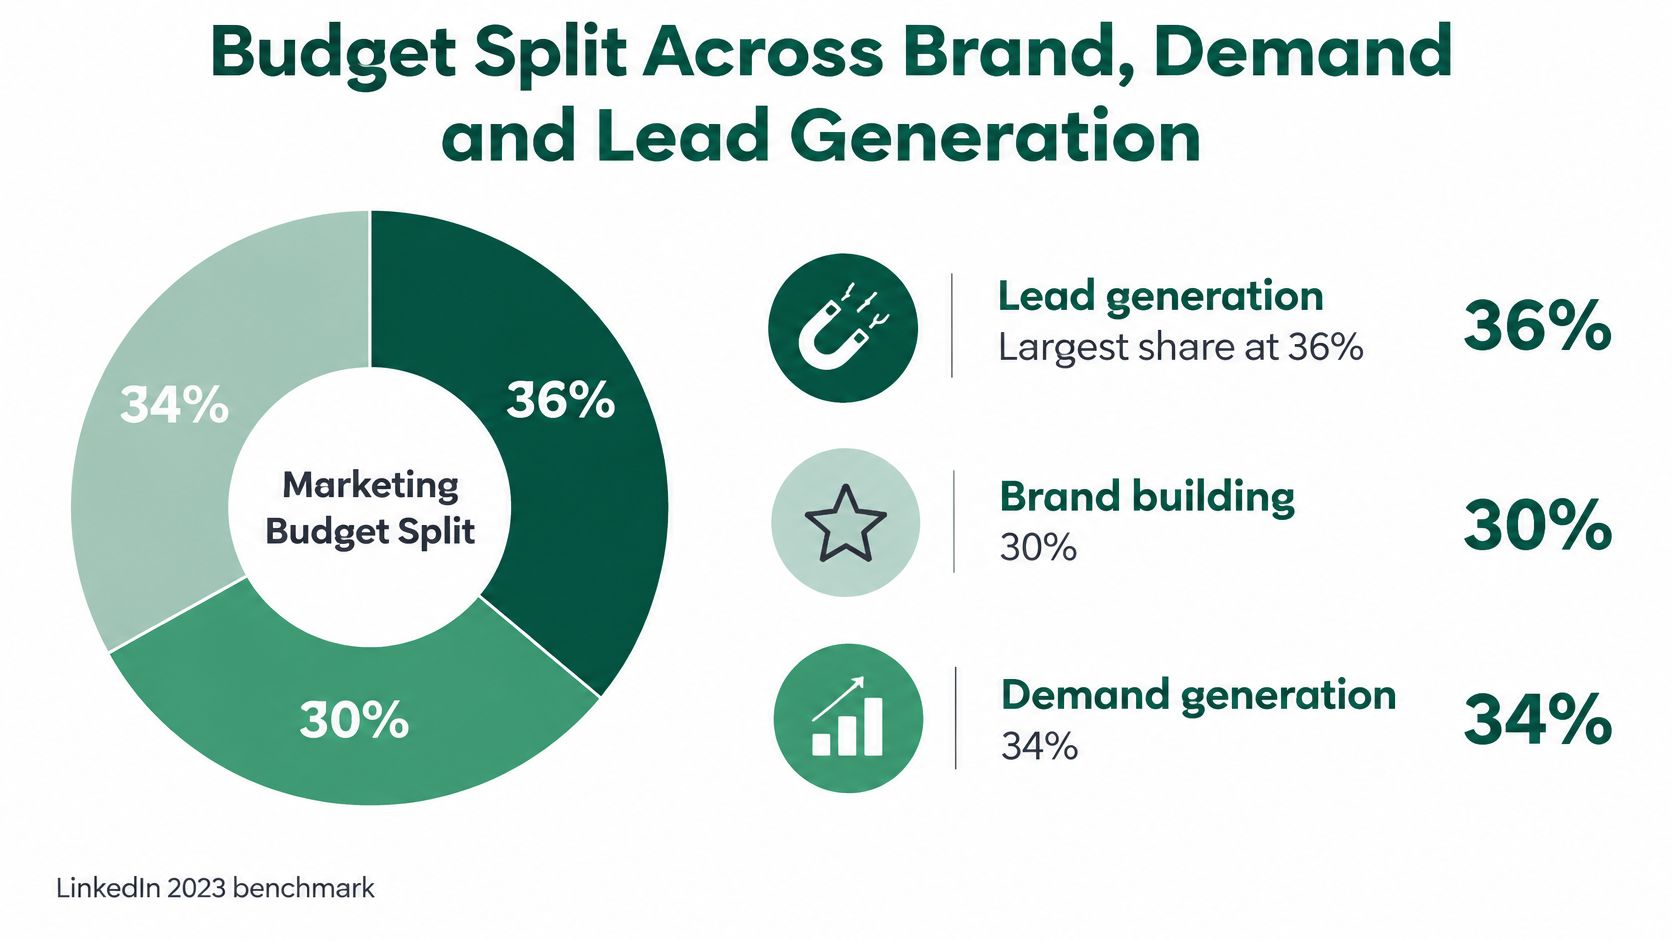
Take a $240,000 annual budget at that split. Lead generation gets $86,400, brand $72,000, demand generation $48,000, and $33,600 stays unassigned until you name it. A pre-product-market-fit company with no category recognition should move money toward brand and proof. A company with a working motion and a sales team that can follow up should move money toward lead generation and pipeline quality. Keep the three lines separate so each has its own metric and its own review date. One blended "pipeline budget" is how brand gets raided every time a month looks soft.
| Budget line | LinkedIn 2023 average share | Fund it when | Common failure |
|---|---|---|---|
| Lead generation | 36% | Pipeline is the immediate constraint and sales has capacity to follow up | Volume without fit inflates MQL counts |
| Brand building | 30% | The category is new or buyers do not recognize you | Hard to attribute, so it gets cut without proxy metrics |
| Demand generation | 20% | Buyers know the category and need reasons to shortlist you | Traffic rises but conversion stalls without proof assets |
Set the clock in the same pass. 90-day milestones cover leading signals such as meetings created and repeat account engagement. 12-month review points cover pipeline and win rate. Judging created pipeline at day 90 is early for most B2B cycles. Engagement that has stalled by day 90 is still a reason to act. For the allocation choices founders argue about, see marketing budget planning for B2B SaaS startups.
Most leadership teams don't trust the numbers they use to move budget, and that distrust is the constraint. Not the dashboard design.
Forrester reported that 64% of surveyed B2B marketing leaders did not trust their organization's marketing measurement for decision-making, while 61% said measurement and analytics were not well aligned with organizational objectives or growth strategy. A channel calendar can't fix that. A governance section can.
Build three layers, and don't let one substitute for the others.
Track sourced and influenced pipeline side by side. A program can create the first touch and still not shape the decision. Brand, partners, sales, and the product itself get undercounted when you only credit the form fill. Add a measurement-risk register: duplicate records, missing campaign IDs, offline events, long sales cycles, and attribution windows set too early. Each risk gets an owner.
The operating sequence is plain. Lock CRM lifecycle definitions. Require source, campaign, account, and opportunity fields. Stamp stage dates. Reconcile marketing and sales pipeline weekly. Run a quarterly cohort by segment and channel.
Scale a channel by 25% only when cost per opportunity stays under target across two consecutive quarterly cohorts. Pause it when two cohorts miss by more than 30%. Otherwise extend the test. Write that sentence before the spend, so nobody renegotiates the result afterward.
Every test also needs a hypothesis, a target segment, an observation period, a success threshold, and a written post-test decision. First-touch and last-touch arguments are a symptom of missing rules, which is why last-touch attribution keeps failing teams that treat it as a verdict instead of one input.
The same template changes shape when the buying group and the conversion change. Pretending one funnel fits both models is how app teams inherit enterprise process, and how SaaS teams judge themselves on install-speed metrics.
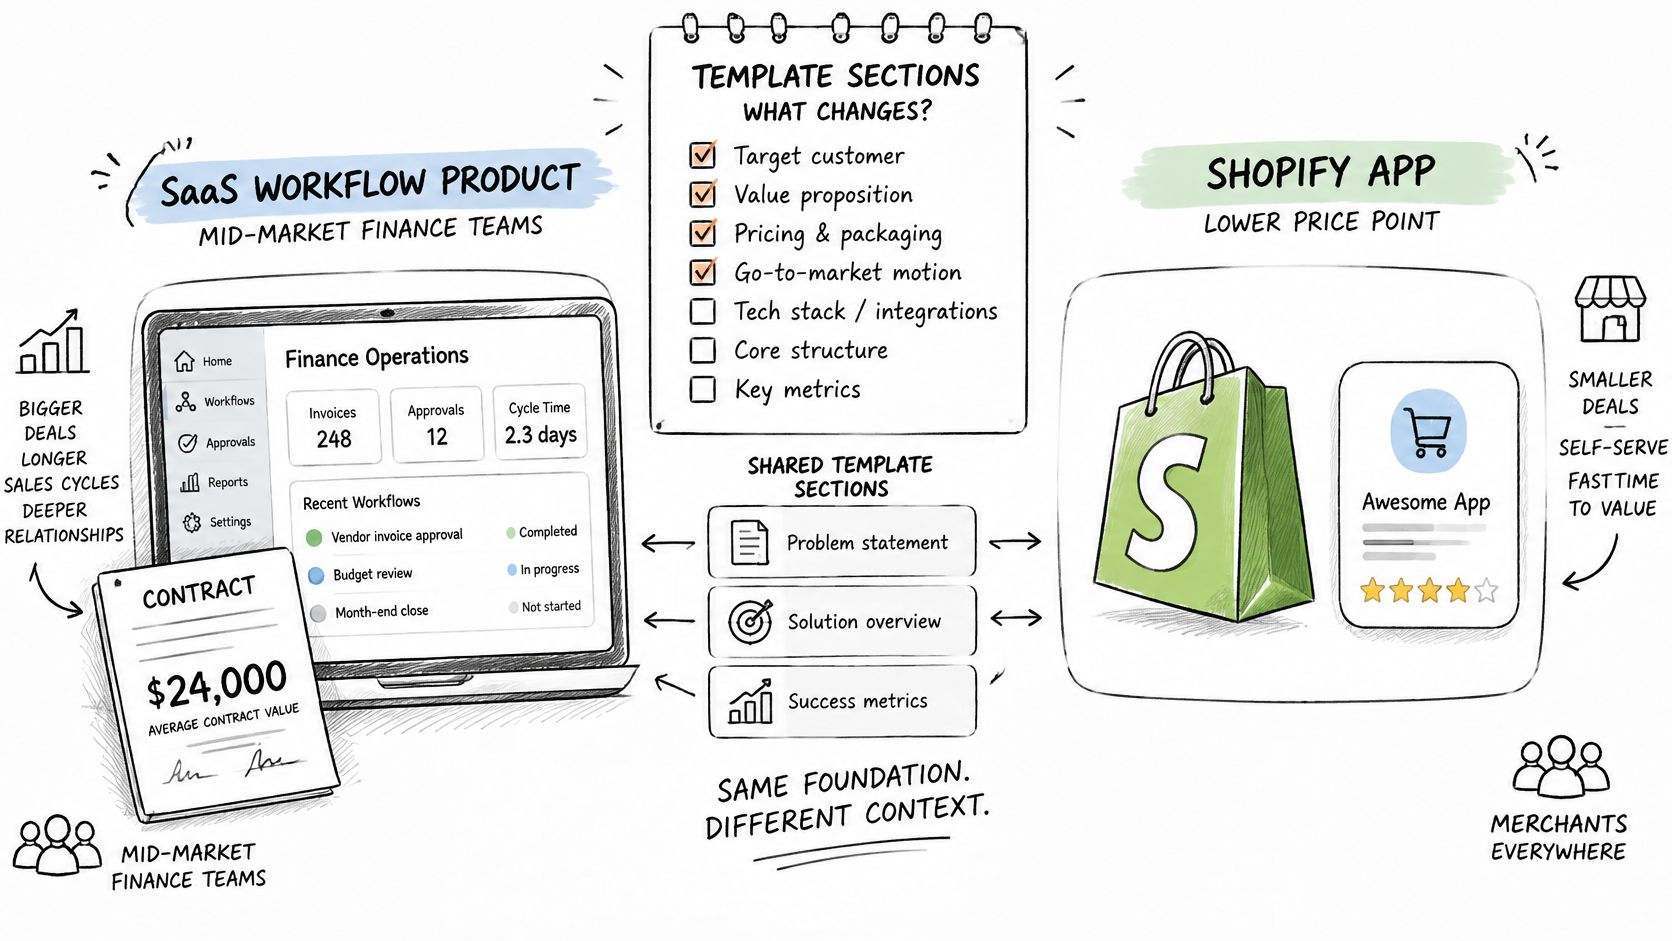
Take a B2B workflow product sold to mid-market finance teams at a $24,000 average contract. The buying group is a champion, a technical evaluator, and a finance approver. Nurture and sales enablement have to hold for months, and the timeline needs 12-month review points. Dreamdata's benchmark, as summarized by LinkedIn, puts the average B2B customer journey at approximately 211 days from a first advertising impression to a final purchase decision. Journeys influenced by LinkedIn ads averaged 320 days. Judging that channel after a few weeks, or only on last touch, will starve the motion that creates late pipeline.
Now take a monthly Shopify app. The merchant installs and starts a trial without a sales conversation. The buying group is often one store owner, sometimes with a developer. The conversion is trial activation, not a demo. The core assets are the app listing, reviews, and setup tutorials. The KPIs are installs and paid conversion. The 211-day figure describes B2B journeys in general, not app installs. Check it against your own install-to-paid time before you borrow it for the app's timeline. Shopify app marketing that ignores listing, reviews, and activation will not be saved by a heavier content calendar.
| Plan element | B2B SaaS (sales-led) | Shopify app (self-serve) |
|---|---|---|
| Buying group | Champion, technical evaluator, finance approver | Store owner, sometimes a developer |
| Typical decision horizon | Months; one benchmark cites about 211 days for B2B journeys | Use your own install-to-paid median, not a B2B journey benchmark |
| Primary conversion | Qualified meeting or demo | Install and trial activation |
| Core assets | Comparison pages, security documentation, customer proof | App listing, reviews, setup tutorials |
| Primary KPI | Opportunities and win rate | Installs and paid conversion |
The section that changes most for the SaaS product is buyer journeys, because three roles need different proof across a long cycle. The section that changes most for the app is measurement, because installs and paid conversion replace opportunities and win rate, and a long-cycle attribution model will misread a short self-serve path.
Without one owner who can change pipeline definitions, pause a channel, and sign the budget split, the plan becomes a list of requests. Marketing asks, sales shrugs, and the founder becomes the default tie-breaker.
Pick the owner by the constraint you have.
Whichever seat you choose, it has to sit between founder, product, and sales. Most plans die at the handoff between marketing qualification and sales acceptance, not in the ad account.
Don't book channels until that review approves the plan. Once the basics hold, pilots on the key B2B channels are the next move, and hiring behind a working motion beats hiring ahead of one.
Big Moves Marketing works with B2B SaaS founders and revenue leaders as a strategic growth partner, building the plan as a revenue decision rather than a channel calendar. We pressure-test positioning, the reverse revenue model, and the measurement rules before spend goes out. If you want that document owned with someone who will also sit with product and sales, visit Big Moves Marketing.