%20png%20copy.avif)
TL;DR:
- A SaaS marketing funnel is circular, emphasizing retention and expansion after the sale, which boosts revenue growth. Focusing on fixing activation leaks yields higher returns than increasing top-of-funnel traffic or ad spend. Most revenue is lost during the activation stage, making it the highest leverage area for improvement.
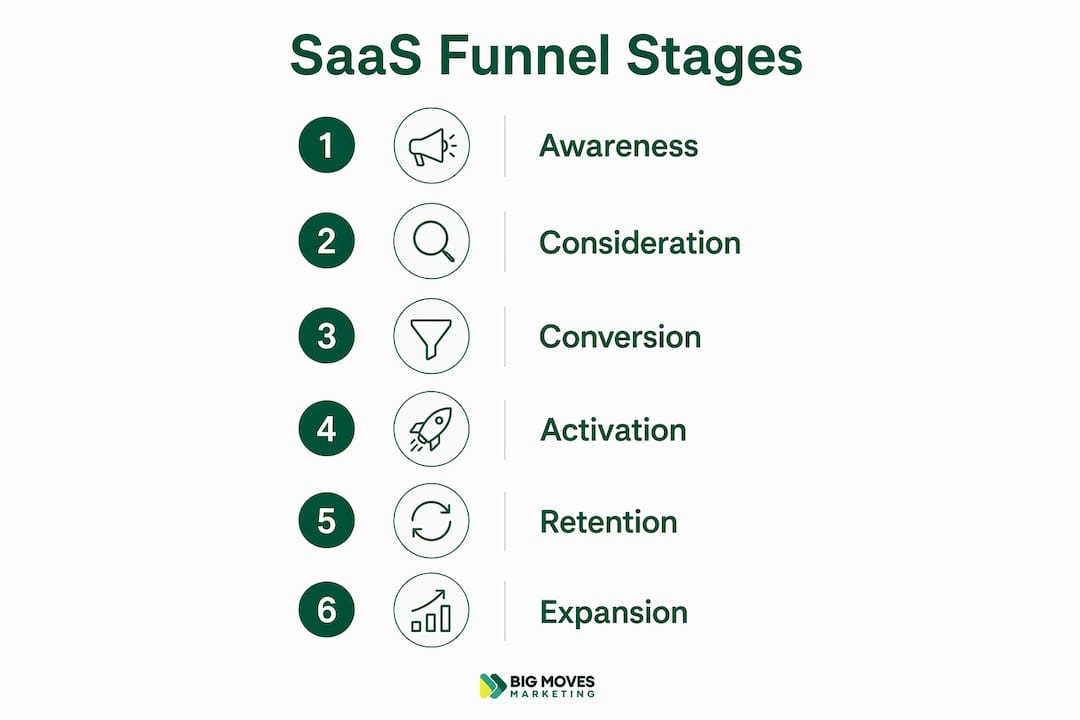
A SaaS marketing funnel maps how strangers become retained, expanding customers. It has six stages: awareness, consideration, conversion, activation, retention, and expansion. Unlike a traditional funnel, it’s circular. Post-sale behavior compounds revenue, so the closed deal is the starting line, not the finish line.
The single highest-leverage action you can take today: find the biggest dollar leak between trial and paid, and fix that first. Not the homepage. Not ad spend. The activation-to-habit step is where most SaaS revenue quietly disappears.
Three facts that frame everything else:
Those three numbers explain why most SaaS funnels underperform: teams optimize for top-of-funnel traffic while buyers self-educate in the dark and existing customers quietly churn.
Traditional B2B funnels are linear. Marketing generates awareness, sales closes the deal, and delivery takes over. Revenue is recognized at close. The funnel ends.

SaaS breaks every one of those assumptions.
Revenue is recognized monthly over a 12–24 month payback window. If a customer churns in month three, you lose money on that acquisition. That single economic fact forces the funnel to extend well past the sale and treat retention as a core growth lever, not an afterthought.
The buyer behavior shift compounds this. With 69% of buyers completing evaluation before speaking to a rep, and 61% preferring a rep-free buying experience, your funnel has to do the selling before a human ever enters the picture. That means self-serve demos, ROI calculators, stakeholder-specific content, and frictionless trials — not just a contact form.
Then there’s expansion. Net revenue retention at 120% or higher means you can grow revenue more than 20% annually from existing customers alone, without adding a single new logo. Expansion is cheaper than acquisition, and existing customers already trust you. The bottom of the funnel drives the most efficient growth in SaaS.
The result: a circular system where retained customers expand, expanded customers refer, and referrals convert at higher rates and lower CAC. The funnel feeds itself.
Pro Tip: Treat activation as the single most predictive stage for trial-to-paid conversion. Before you touch ad spend or homepage copy, measure what percentage of trial users hit your core activation event in week one. That number tells you more about funnel health than any top-of-funnel metric.
Each stage has a distinct buyer task, a set of channels that feed it, and metrics that tell you whether it’s working.
The buyer task here is simple: recognize the problem and find credible sources. They’re searching, scrolling, and comparing categories. Your job is to show up where they look.
SEO is the workhorse at this stage. Top-performing B2B SaaS companies convert visitors to leads at 8–15%, while average companies land closer to 1.4–2.5%. The gap is almost always content quality and search intent alignment, not ad budget. LinkedIn thought leadership and webinars also punch above their weight here for B2B audiences.
Key metrics: organic sessions, branded search volume, share of voice, visitor-to-trial rate (benchmark: 2–5%).
The buyer is now evaluating options. They’re reading comparison pages, watching demos, and building an internal business case. This is where committee dynamics kick in. A typical B2B SaaS deal involves multiple stakeholders, each with different concerns: the end user wants ease of use, the CFO wants ROI, IT wants security.
Your funnel needs stakeholder-specific assets: ROI calculators, security one-pagers, integration documentation, and case briefs by industry. Content that only speaks to one persona loses the deal at the committee stage.
Key metrics: MQL volume, lead-to-MQL rate, content engagement depth, demo request rate.
The buyer decides to try or buy. For most SaaS products, this means starting a trial or signing up for a freemium tier. Friction here is expensive. Every extra field, every required credit card, every unclear value proposition costs you signups.
Onboarding starts at signup, not after. The first screen a new user sees sets the expectation for activation. Get that screen wrong and the rest of the funnel doesn’t matter.
Key metrics: visitor-to-trial rate, trial-to-paid rate (benchmark: 10–25% for time-limited trials, 2–5% for freemium), MQL-to-SQL rate, opportunity-to-close rate.
Activation is the moment a user first experiences the core value of your product. It’s the “aha moment.” Users who hit it convert to paid at dramatically higher rates. Users who don’t, churn.

The benchmark for activation in week one is 25–40%, with 40–60% considered excellent. Most teams do not measure this at all, which is why activation remains the most common and most expensive leak in the SaaS funnel.
Key metrics: activation rate (core action in first 7 days), time-to-activation, feature adoption rate.
A retained customer is a profitable customer. Annual logo retention above 90% is the floor; 98%+ is best in class. Monthly churn above 2% compounds into serious revenue loss over 12 months.
Retention is driven by habit formation. Users who return three or more times in the first seven days convert and retain at materially higher rates. A three-trigger re-engagement sequence in the first week, tied to specific in-product behaviors, outperforms any scheduled email campaign.
Key metrics: monthly and annual churn rate, daily/weekly active users, NPS, customer health score.
Expansion is where SaaS economics get interesting. Upsells, cross-sells, seat additions, and tier upgrades all compound NRR. The trigger for expansion should be behavioral, not calendar-based. When a user hits a meaningful product limit or achieves a clear outcome, that’s the moment to prompt an upgrade.
Key metrics: NRR (benchmark: 106%+, excellent: 120%+), GRR, expansion MRR, upsell conversion rate.
Funnel stage benchmarks at a glance:
| Funnel stage | Key metric | Healthy benchmark |
|---|---|---|
| Awareness | Visitor to trial start | 2–5% |
| Conversion (trial) | Free trial to paid | 10–25% |
| Conversion (freemium) | Free user to paid | 2–5% |
| Activation | Core action in first week | 25–40% (40–60% excellent) |
| Retention | Annual logo retention | 90%+ (98%+ best in class) |
| Expansion | Net revenue retention | 106%+ (120%+ top performers) |
Sources: Rework SaaS benchmarks; Prospeo SaaS funnel data
Pro Tip: Define your activation event as the single action that most strongly predicts paid conversion. Remove every screen or step between signup and that event. Fewer steps to activation means more paid customers, full stop.
Every growth team needs a short list of metrics they can calculate, monitor, and act on. Here’s the core set.
CAC (Customer Acquisition Cost) Total sales and marketing spend in a period divided by new customers acquired. CAC tells you what you’re paying to fill the funnel. The median varies significantly by ACV, but the ratio that matters is LTV:CAC.
LTV (Customer Lifetime Value) Average revenue per account divided by your churn rate. A healthy LTV:CAC ratio is approximately 3:1. Below 1:1 means you’re losing money on every customer.
CAC Payback Period CAC divided by monthly gross margin per customer. This tells you how many months until a new customer pays back their acquisition cost. Under 12 months is strong for most SaaS models; 18–24 months is acceptable for enterprise.
Activation Rate Users who complete the core activation event divided by total signups. Measure this in the first 7 days.
Trial-to-Paid Conversion Rate Paid conversions from a trial cohort divided by total trial starts. Track this by cohort, not as a rolling average, or you’ll miss seasonal and campaign-driven distortions.
Churn Rate (Logo and Revenue) Logo churn: customers lost divided by customers at start of period. Revenue churn: MRR lost to cancellations divided by MRR at start of period. Track both. A company can have low logo churn and high revenue churn if it’s losing its largest accounts.
NRR (Net Revenue Retention) Starting MRR plus expansion minus contraction minus churn, divided by starting MRR. This is the single most important metric for SaaS health. Above 100% means you grow revenue from existing customers even without new acquisition.
GRR (Gross Revenue Retention) Starting MRR minus contraction minus churn, divided by starting MRR. GRR excludes expansion and shows your baseline retention floor. Healthy GRR is 85%+ for SMB, 90%+ for mid-market and enterprise.
| Metric | Formula | Healthy range |
|---|---|---|
| CAC | Sales + marketing spend ÷ new customers | Varies by ACV |
| LTV:CAC | LTV ÷ CAC | ~3:1 or higher |
| CAC payback | CAC ÷ monthly gross margin per customer | Under 12–18 months |
| Activation rate | Activated users ÷ signups (7 days) | 25–40% |
| Trial-to-paid | Paid conversions ÷ trial starts | 10–25% |
| Monthly churn | Customers lost ÷ customers at period start | Under 2% |
| NRR | (Start MRR + expansion − contraction − churn) ÷ start MRR | 106%+ (120%+ top performers) |
| GRR | (Start MRR − contraction − churn) ÷ start MRR | 85–90%+ |
Where to capture each metric: activation and product events in Mixpanel, Amplitude, or PostHog; revenue metrics in your billing system (Stripe, Chargebee); pipeline and CAC in your CRM (HubSpot, Salesforce); NPS in Delighted or Typeform.
Quick calculation example: 500 trial starts in a month, 75 convert to paid. Trial-to-paid = 75 ÷ 500 = 15%. If your CAC is $1,200 and monthly gross margin per customer is $150, CAC payback = 1,200 ÷ 150 = 8 months. Both numbers are healthy. Now check activation: if only 20% of those 500 trials hit your activation event, that’s your leak.
This is a runnable plan. Follow the sequence.
Before you build anything, answer two questions. Who is your ideal customer profile (ICP), and what is the single in-product action that most strongly predicts paid conversion?
For ICP, define firmographics (company size, industry, tech stack), buying committee roles (champion, economic buyer, technical evaluator), and the specific pain they’re hiring your product to solve. For the activation event, look at your paid customer cohort and find the one action they all completed in week one that free users who churned did not. That’s your activation event.
For each funnel stage, list what the buyer needs to accomplish and what asset enables it:
For B2B customer journey mapping in detail, the buyer task framework is the right starting point.
Don’t spread across six channels at launch. Pick based on ACV and buyer intent:
SEO drives the highest visitor-to-lead rates over time. Webinars produce the highest-quality leads per session. Paid search often bleeds at MQL-to-SQL unless your targeting is tight.
Before you launch, confirm:
Days 1–30: ICP defined, activation event identified, tracking plan live, signup flow audited, first three awareness assets published.
Days 31–60: Activation sequence live, MQL definition agreed, CRM wired, first paid channel test running, activation rate baseline measured.
Days 61–90: First cohort analyzed, trial-to-paid rate measured, top leak identified and first experiment running, NRR baseline set.
Optimization is not a one-time project. It’s a sprint cadence. Here’s the framework.
Model 1,000 visitors through your real conversion rates at each stage. Estimate the monthly revenue impact of a 10% improvement at each step. The step with the highest dollar impact gets the first experiment. This is revenue-order prioritization, and it consistently points to activation and trial-to-paid before homepage or ad spend.
The order of priority is almost always: trial→activation first, then activation→habit, then habit→paid, and homepage→trial last. Most teams invert this and wonder why their funnel doesn’t improve.
Every experiment needs six elements before it starts; use tools like the AI Digital Product Builder for rapid idea validation and iterative product experiments.
Cohort analysis shows you how groups of users behave over time. Run monthly cohorts and track activation rate, trial-to-paid, and 90-day retention for each. When a cohort underperforms, look at what changed: acquisition channel, onboarding flow, product update.
Path analysis shows you what users actually do between signup and activation (or churn). Tools like Mixpanel and Amplitude let you map the happy path and identify where users drop off. The gap between the happy path and the actual path is your optimization target.
For a deeper dive into refining your B2B SaaS sales funnel, cohort analysis is the most reliable diagnostic tool available.
Pro Tip: Skip the scheduled upgrade email. Instead, trigger upgrade prompts the moment a user hits a meaningful product limit or achieves a clear outcome. “You’ve created 10 projects — upgrade to unlock unlimited” converts far better than “Your trial ends in 3 days.” Reference the exact value the user achieved, not the clock.
These are the errors that cost the most money and take the least time to fix.
For teams building a SaaS retention playbook, fixing the activation stage is always the prerequisite. You can’t retain users who never activated.
When to use: Low-to-mid ACV (under $10K ARR), high-volume market, product that delivers value quickly without a sales conversation.
How it works: Users sign up without talking to sales, experience the product, and upgrade based on usage. The funnel is almost entirely automated. Activation engineering and in-app onboarding carry most of the conversion weight.
Must-have assets: Frictionless signup (under 60 seconds), in-app onboarding checklist, three-trigger behavioral email sequence, usage-based upgrade prompts, self-serve help center.
Sample metrics to aim for: Visitor-to-trial 3–5%, trial-to-paid 10–20% (opt-in model), activation rate 30–50%.
Trial model note: Opt-out trials (credit card required) convert to paid at higher rates but reduce signup volume. Freemium drives higher signup volume but lower paid conversion (2–5%). Choose based on whether you need volume or conversion efficiency.
When to use: Mid-market ACV ($10K–$50K ARR), product complexity requires a demo or onboarding call, buying committee has 2–4 stakeholders.
How it works: Users start a trial, and lead scoring identifies high-intent accounts for sales outreach. Sales assists with demo, objection handling, and procurement. The trial is the proof-of-concept.
Must-have assets: Lead scoring model (product usage + firmographic signals), demo request flow, sales-to-success handoff playbook, stakeholder one-pagers, ROI calculator.
Sample metrics to aim for: Trial-to-demo rate 15–25%, demo-to-close rate 20–35%, trial-to-paid 15–25%.
When to use: Enterprise ACV (above $50K ARR), long sales cycles (90–180 days), procurement and legal involvement, multiple stakeholders including C-suite.
How it works: Product usage signals identify product-qualified leads (PQLs) within a free tier or pilot. Sales engages PQLs with a proof-of-concept (POC) proposal. The funnel is account-based, not volume-based.
Must-have assets: PQL scoring model, POC playbook, executive business review (EBR) template, security and compliance documentation, procurement checklist, stakeholder enablement kit (separate decks for champion, CFO, IT).
Sample metrics to aim for: PQL-to-opportunity rate 20–40%, opportunity-to-close rate 25–35%, average sales cycle 90–180 days.
For more on how to market a SaaS product across these motion types, the channel mix shifts significantly between PLG and enterprise.
Bigmoves is a B2B marketing consultancy led by Veb, with 17 years of experience across 75+ SaaS startups and enterprises. The methodology is built around one principle: fix the highest-dollar leak first, then build the system around it.
Discovery phase:
Funnel wiring:
Activation engineering:
Retention and expansion plays:
Execution channels:
Service scope: strategic positioning and messaging, go-to-market planning, demand generation, content strategy, website deployment, and pilot-led channel execution. Engagements range from a focused funnel audit to a full 90-day growth sprint to an ongoing fractional CMO retainer.
For teams building from scratch, the SaaS marketing strategy framework is the right starting point before wiring the funnel.
A well-built SaaS marketing funnel compounds revenue at every stage: fix activation first, then retention, then expansion, and top-of-funnel growth becomes far more efficient.
| Point | Details |
|---|---|
| Fix leaks in revenue order | Prioritize trial→activation before homepage or ad spend; that’s where most SaaS revenue disappears. |
| Activation is the key predictor | Users who hit the core activation event in week one convert and retain at materially higher rates. |
| NRR is the north star | Target 106%+ NRR; with 120%+ considered top performance and enabling more than 20% annual revenue growth from existing customers alone. |
| Behavioral triggers outperform schedules | Contextual upgrade prompts tied to product limits convert far better than time-based trial expiry emails. |
| Bigmoves builds the full system | Bigmoves audits your funnel in revenue order, wires tracking and CRM, and runs 90-day growth sprints for B2B SaaS teams. |
Most SaaS teams treat the funnel as a visualization exercise. They draw the stages, assign owners, and move on. The teams that actually grow treat it as a measurement system with a clear optimization order.
The insight that changes everything is simple: the closed deal is the starting line. Everything before it is the cost of getting there. Everything after it is where the return is built. Activation, retention, and expansion aren’t post-sale support functions. They’re the core of the revenue model.
The other thing worth saying plainly: most funnels leak at activation, not at the top. Teams spend 80% of their budget on awareness and conversion while ignoring the stage that determines whether any of that spend pays back. A 10% improvement in activation rate is almost always worth more than doubling your ad budget.
The average B2B SaaS sales cycle reached 134 days in 2025, meaning buyers are spending months evaluating before they speak to anyone. Your funnel has to do the work of a sales team before a sales team ever enters the picture. That’s not a content marketing problem. It’s a funnel architecture problem.
Most B2B SaaS teams know their funnel leaks. Few know exactly where, or what fixing it is worth per month.
Bigmoves starts with a two-week funnel audit: model your current conversion rates in revenue order, identify the top one or two leaks, and price them in monthly revenue. From there, the 90-day sprint wires the tracking, fixes the activation flow, and launches the demand generation channels most likely to move your specific ACV. For teams that need ongoing strategic leadership, the fractional CMO engagement covers positioning, messaging, channel execution, and funnel iteration on a retained basis.
Typical time to first measurable impact: 30–45 days from audit completion. No 12-month retainer required to start.
If you’re ready to stop guessing which stage is costing you the most revenue, see how Bigmoves works and book a discovery call.
The benchmarks and frameworks in this article draw from the following primary sources. Each is worth reading in full for the data behind the numbers.
The 134-day average B2B SaaS sales cycle, together with 69% of buyers completing evaluation before contacting sales, means your funnel must do the selling long before a human enters the conversation. Build for self-serve evaluation first.
A SaaS marketing funnel is the six-stage system that moves prospects from awareness to retained, expanding customers: awareness, consideration, conversion, activation, retention, and expansion. Unlike a traditional funnel, it’s circular because subscription revenue compounds after the sale.
The core metrics are activation rate, trial-to-paid conversion rate, CAC payback period, LTV:CAC ratio, monthly churn, NRR, and GRR. NRR is the north star: top performers target 106%+ with best-in-class teams reaching 120%+.
The four P’s (product, price, place, promotion) apply in SaaS but shift in emphasis: product is the primary growth lever in PLG motions, pricing directly drives trial-to-paid conversion, place means the channels where buyers self-educate, and promotion must reach buyers during the 134-day average B2B SaaS sales cycle before they contact sales.
Fix activation before anything else. Model your current conversion rates in revenue order and price each leak in monthly dollars. The trial-to-activation step almost always recovers more revenue per experiment than any top-of-funnel improvement.
Bigmoves runs a two-week funnel audit to identify and price your top leaks, then executes a 90-day sprint covering activation engineering, CRM wiring, and demand generation channel launch. Fractional CMO engagements are available for teams that need ongoing strategic leadership.



%20-%20white.svg)