%20png%20copy.avif)
The pipeline coverage ratio is your total qualified pipeline value divided by your revenue target for the same period. A 3:1 ratio means three dollars in qualified pipeline for every dollar of quota. Before you trust that number, check two things: does your pipeline period match your revenue period, and did you filter out deals that aren’t actually qualified?
TL;DR:
- A pipeline with a 3:1 ratio is only reliable if the deals are well-qualified, with documented stakeholders, confirmed budgets, and verified closing timelines.
- Accurate calculation requires matching the pipeline period with the revenue target and removing stale, duplicate, or unqualified deals before assessing coverage.
- Using unweighted and weighted coverage together provides a more complete view, with early-quarter metrics favoring volume and later-stage metrics supporting forecasting.
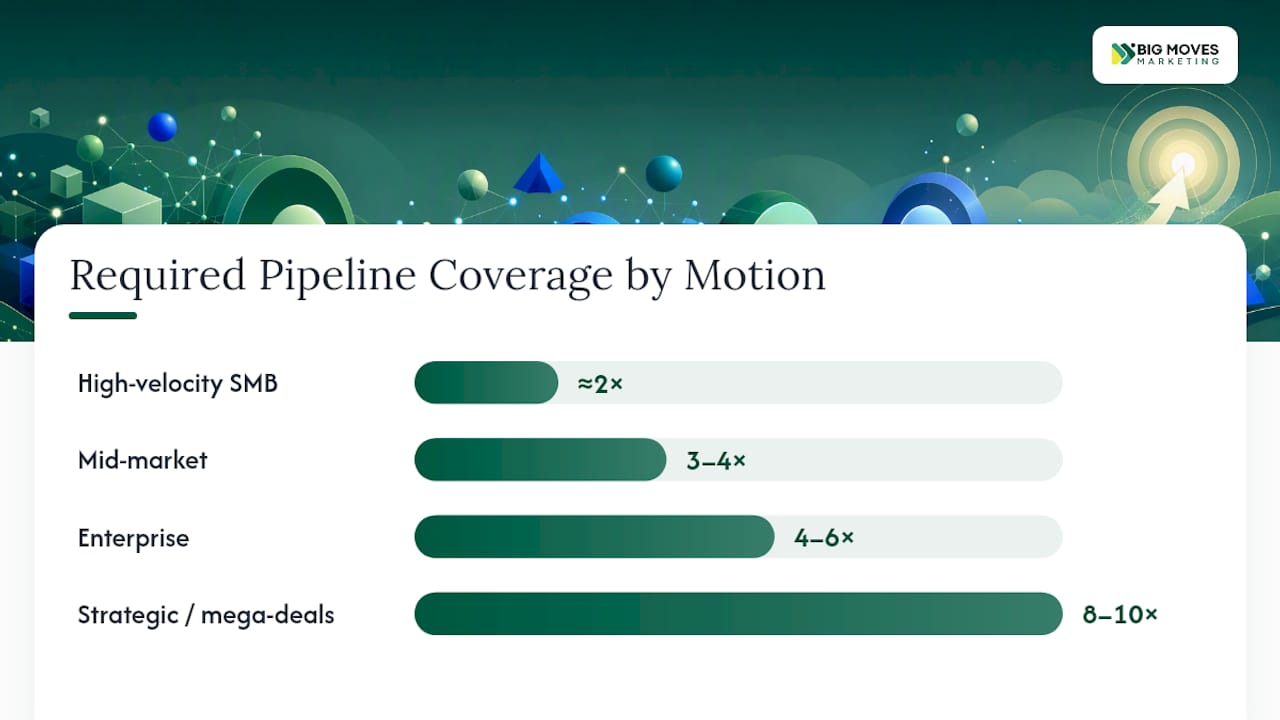
- The ideal coverage ratio varies by sales motion, from around 2x for high-velocity SMB to 8-10x for strategic mega-deals, based on the team’s win rate.
- Weekly measurement and segment-based analysis are crucial to catch slippage early and ensure pipeline quality, not just quantity.
Pipeline coverage answers a blunt question: do you have enough in the pipe to hit your number? The formula is simple: qualified pipeline value divided by revenue target, expressed as a ratio like 3:1 or 4:1.
Here’s the math in action. Say your team carries a certain quota for the quarter. Your CRM shows open opportunities set to close in that same window. Dividing pipeline value by quota gives your coverage ratio.
That number only means something if the pipeline behind it is real. Three things separate qualified pipeline from wishful thinking:
Skip this filter and your ratio inflates fast. A pipeline stuffed with unqualified leads can show 5:1 coverage and still miss quota by 40%.
Getting the ratio right takes more than dividing two numbers. Period alignment is where most calculations break. If your revenue target covers Q2 (April through June), your pipeline value must reflect only deals with close dates inside that same window. Pull in deals closing in July and you’ve built a number that describes the wrong quarter.
Follow this sequence every time you calculate coverage:
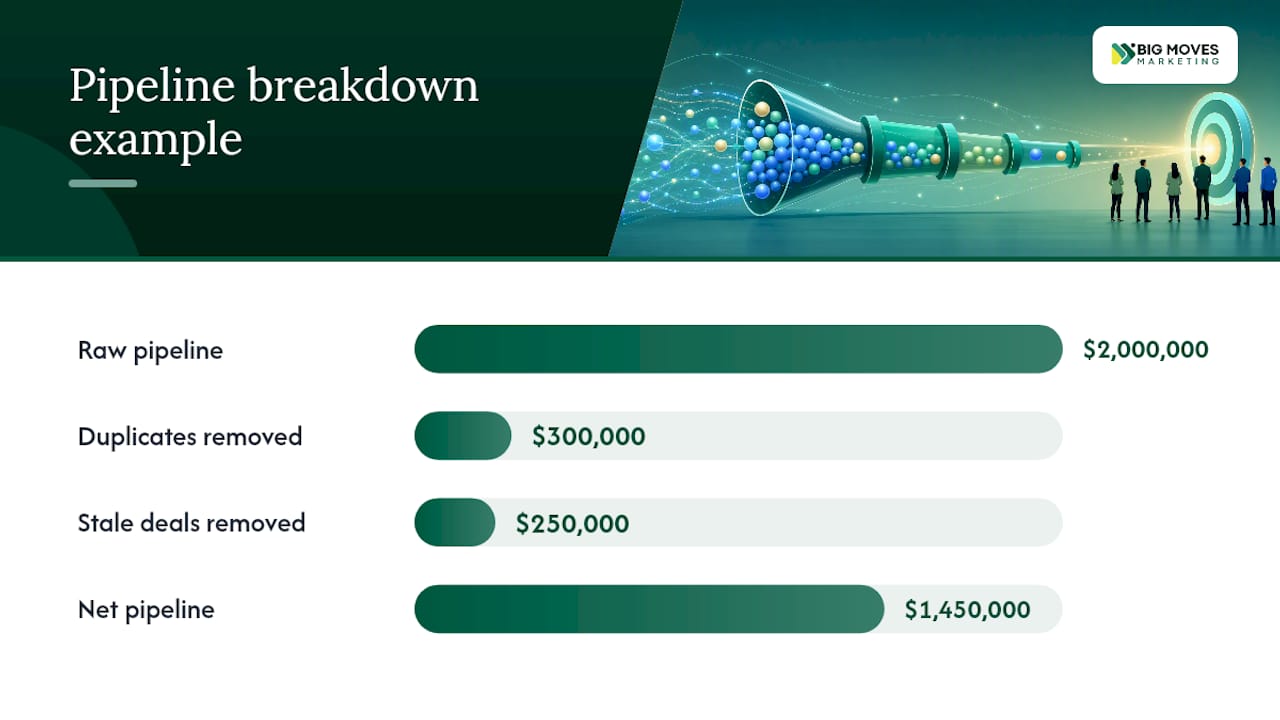
Worked example: your raw pipeline shows $2 million against a $500,000 target, a tidy 4:1. After removing $300,000 in duplicate entries and $250,000 in deals sitting stale for 150 days against a 60-day average cycle, your real pipeline is $1.45 million. That’s 2.9:1, not 4:1, and it’s the number that should drive your forecast conversation.
Pro Tip: Run your filtered calculation every Monday morning before your pipeline review. A ratio that looks healthy on the 1st can quietly rot by the 15th if nobody’s checking for stale deals.
Unweighted coverage counts full deal value regardless of how likely it is to close. Weighted coverage multiplies each deal’s value by its stage probability, so a $100,000 deal at 20% probability contributes $20,000 to the total.
Both views earn their place, but they answer different questions:
Smart revenue leaders track both numbers side by side, not one instead of the other. Combining weighted and unweighted views gives you volume and expected value in the same glance.
Forget the generic “you need 3x coverage” advice. That figure comes from legacy enterprise sales math and often steers modern teams wrong. The better method is to derive your own target from your actual win rate: required coverage equals 1 divided by win rate.
If your team closes 25% of qualified opportunities, you need 4x coverage. Close at 33%, and 3x covers you. The math is unforgiving in both directions: overestimate your win rate and you’ll chronically under-pipeline; underestimate it and you’ll pressure reps into padding forecasts with junk deals.
| Sales Motion | Typical Win Rate Range | Required Coverage Range |
|---|---|---|
| High-velocity SMB | higher win rates (around 40-60%) | low coverage ratio needed (around 2 times) |
| Mid-market | moderate win rates (around 25-40%) | moderate coverage ratio needed (around 3 to 4 times) |
| Enterprise | lower win rates (around 25%) | higher coverage ratio needed (around 4 to 6 times) |
| Strategic / mega-deals | very low win rates (around 10%) | highest coverage ratio needed (around 8 to 10 times) |
These ranges vary by motion because sales cycle length, deal complexity, and buyer risk tolerance differ sharply between a self-serve SMB motion and a multi-stakeholder enterprise sale.
A coverage ratio alone can’t tell you if the pipeline is healthy or at risk; it must be combined with quality signals to be meaningful. A reliable coverage read pairs the ratio with quality signals:
Coverage is only as trustworthy as the pipeline behind it. A team reporting 4:1 coverage built mostly on single-threaded, stage-one deals is in worse shape than a team at 2.8:1 with multi-threaded, late-stage opportunities.
Segment before you judge the headline number. Break coverage down by rep, product line, geography, and motion, since aggregate coverage can hide serious risk in a single underwater territory.
| Pattern You See | What It Likely Means | First Action |
|---|---|---|
| High coverage, mostly early stage | Volume without qualification | Audit top 10 deals for documented intent |
| Low coverage, mostly late stage | Real risk of missing quota | Launch a pipeline-generation push immediately |
| Coverage healthy, one rep far below | Individual execution or territory gap | Pair the rep with a manager for deal reviews |
| Coverage steady, win rate dropping | Deal quality slipping, not volume | Review qualification standards, not lead volume |
Coverage isn’t a set-it-and-check-it-quarterly metric. It moves weekly, and treating it as static is how teams get blindsided in the final two weeks of a quarter.
Weekly checks catch slippage while there’s still time to react. Monthly and quarterly recalibration keeps your benchmark honest instead of running on a stale win rate from two quarters ago.
Once you’ve diagnosed a coverage problem, four levers fix it. Pick based on what your diagnostics actually showed, not on habit.
Tactical programs fix a short-term gap: a campaign push, a stalled-deal sprint, a qualification tightening exercise. A structural gap, where coverage has missed target for multiple consecutive quarters, calls for a bigger decision: adjusting quota, expanding headcount, or re-scoping territories.
Pro Tip: Assign each lever to a specific owner before your next pipeline review. “Create more pipeline” belongs to marketing and SDRs. “Accelerate existing deals” belongs to the AE and their manager. Vague ownership is why coverage gaps linger for months.
Most bad coverage numbers trace back to a handful of repeatable errors:
Run a quick validation before every review: recheck period alignment, scan for deals older than twice your sales cycle, and confirm no account appears twice.
This guide comes from Bigmoves, led by Veb, who has spent 17 years building go-to-market systems for more than 75 startups and enterprise technology companies. That work centers on one recurring problem: pipelines that look full on paper but collapse under real scrutiny.
Bigmoves’ positioning and messaging frameworks exist to fix the upstream cause of weak coverage: unclear targeting that fills a CRM with deals that were never going to close. Clients working with the firm on go-to-market alignment have used these frameworks to connect marketing output directly to pipeline quality metrics that sales leaders can actually forecast against, rather than raw lead counts that mean nothing on their own.
If you take one thing from this guide, measure coverage weekly, not quarterly, and always segmented, never as one blended company number. Clean data beats a bigger pipeline every time. This week, run a sanity check: pull your top 10 open deals and verify each one has a real stakeholder, a real budget, and a real next step. If Bigmoves’ approach to go-to-market alignment sounds useful, our website services are built to turn that clarity into pipeline that actually closes.
— Veb
Divide total qualified pipeline value by your revenue target for the same period. For example, a $2 million pipeline against a $500,000 target gives you 4:1 coverage.
It depends on your win rate: divide 1 by your historical win rate to find your required coverage.
It means you have $3 in qualified pipeline for every $1 of revenue target.






%20-%20white.svg)