%20png%20copy.avif)
TL;DR:
- Firms should prioritize improving retention through structured onboarding, proactive success, and measured acquisition channels. Fixing churn and onboarding first creates a foundation for scalable growth, making client acquisition and retention a compounding engine. Scaling acquisition without addressing retention risks higher costs and faster churn, undermining long-term profitability.
Prioritize retention first. Fix churn and onboarding, then scale acquisition into a healthy bucket. That’s the one-sentence plan. The three levers that move the needle fastest: structured onboarding that delivers value in the first 30 days; proactive customer success with health scoring; and targeted acquisition channels with a measured CAC payback period. Get those right, and client acquisition and retention become a compounding growth engine rather than a treadmill.
Start here this week:
These three terms get used interchangeably in team meetings. They shouldn’t be. Each represents a distinct motion with its own metrics, owners, and economics.
Client acquisition is the process of attracting and converting net-new clients. It covers everything from first awareness through signed contract. As Forbes notes, acquisition is fundamentally about finding right-fit customers, not just any customers.
Client retention is keeping clients active and renewing. In SaaS, that means preventing churn. In professional services, it means maintaining the engagement or contract. Retention starts the moment a contract is signed, not at renewal.
Client development (also called expansion) is growing revenue from existing clients through upsell, cross-sell, or scope expansion. This is where net revenue retention (NRR) above 100% comes from.
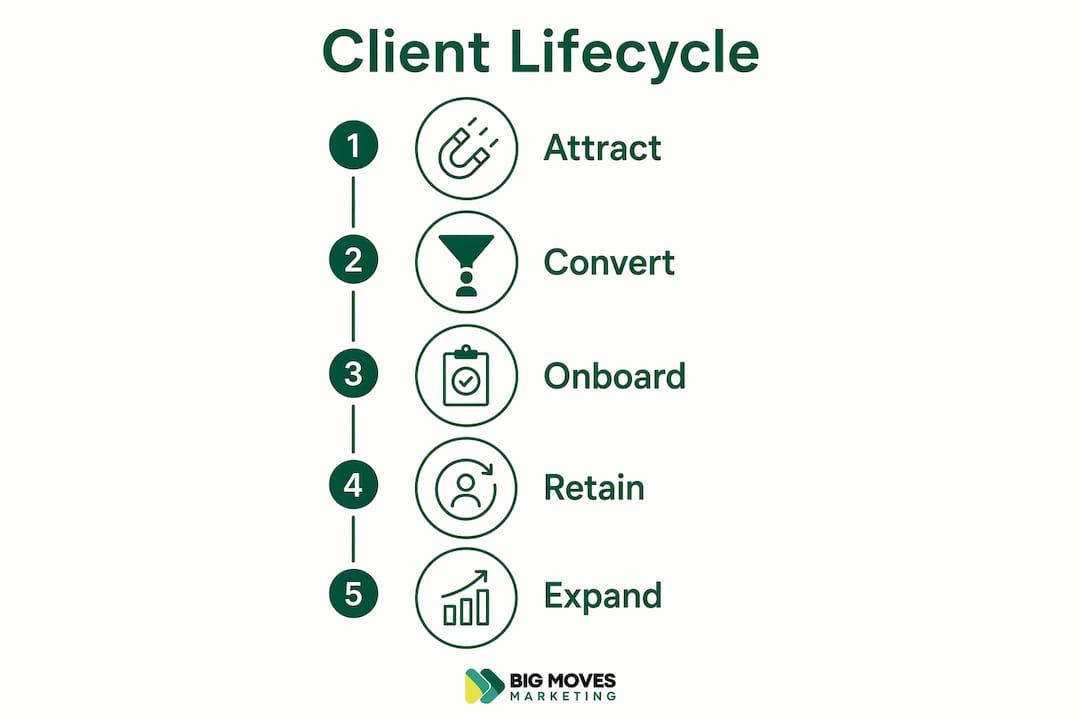
The lifecycle flows like this:
Attract → Convert → Onboard → Adopt → Expand → Advocate Each stage has a different owner, a different metric, and a different failure mode. Most revenue leaks happen at the handoff between stages.
This guide focuses on B2B SaaS and professional services mechanics. Consumer e-commerce has different unit economics and different churn drivers. The frameworks here are built for recurring-revenue and project-based B2B businesses.
The math is straightforward, even if most teams ignore it. Replacing a churned client requires acquiring roughly three new clients to recover the same lifetime value, once you account for onboarding costs, ramp time, and lost referral potential. That’s a punishing ratio.

Acquisition costs significantly more than retention depending on your business model, according to industry research. A modeled five-year scenario from Pharallax AI shows retention-focused investment outperforming acquisition-focused investment by approximately 2.4x, driven by saved churn, referral compounding, and expanded lifetime value.
The compounding effects stack in three ways:
The practical rule: prioritize retention until annual churn is below your vertical’s target threshold. Scaling acquisition into a leaky bucket just accelerates the loss.
Not all channels are equal, and the right mix depends on your ACV, sales cycle, and team capacity. Here’s how to think about channel selection before spending a dollar.
CAC = Total sales and marketing spend ÷ Number of new clients acquired (same period)
Payback period = CAC ÷ Monthly gross margin per client
Multi-touch attribution gives a more accurate picture than first-touch or last-touch alone. At minimum, track which channel sourced the lead and which channel influenced the final decision. Most CRMs support this with basic UTM discipline.
Pro Tip: Before running expensive paid ads or hiring an SDR, qualify your ICP tightly. A 10-question qualification checklist before a demo cuts wasted CAC by removing prospects who will never close or will churn fast.
Retention is won or lost in the first 90 days. Firms without structured onboarding lose a significant portion of new clients in that window. A structured sequence fixes that.

A proven eight-step onboarding flow covers: welcome, intake, document collection, contracts, kickoff, setup, training, and first value delivery. The minimum outputs for any B2B engagement:
Pro Tip: Ask for specific documents by name (“W-9” not “tax documents”). Specific requests get completed. Category requests get ignored. Use a single client portal so nothing gets lost in email.
Health scoring is the backbone of proactive retention. Score each account on product adoption, support ticket volume, stakeholder engagement, and contract renewal date. Accounts below a threshold trigger an escalation playbook, not a reactive call after they’ve already decided to leave.
Quarterly business reviews (QBRs) keep strategic alignment visible. The agenda: results against agreed metrics, blockers, and the next 90-day plan. QBRs also surface expansion opportunities naturally.
Loyalty program participation correlates strongly with repeat purchases: 84% of loyalty program members are more likely to buy again, per Salesforce research. For B2B, loyalty mechanics look different from consumer programs. Think: priority access to new features, dedicated success resources, or referral incentives tied to contract expansion.
Personalization powered by data drives retention more reliably than blanket discounting. Segment communications by industry, use case, and lifecycle stage. Branding personalization at the account level, from onboarding materials to QBR decks, signals that you treat each client as a distinct business.
Context loss at the sales-to-success handoff is one of the most common causes of early churn. The client just bought based on a set of promises. If the CS team doesn’t know what was promised, the relationship starts with a gap.
Before the kickoff call, the CS team needs:
Pro Tip: Schedule the 30-day review during the kickoff call, before anyone leaves the room. If it’s not on the calendar at kickoff, it usually doesn’t happen.
The handoff is repeatable only when it’s documented. Build a shared handoff template in your CRM. Every deal that closes should populate the same fields before it moves to CS.
Track the metrics that connect acquisition cost to lifetime value. Everything else is secondary.
Segment every metric by ARR band, acquisition channel, and industry vertical. A blended churn rate hides the fact that your enterprise segment retains well while your SMB segment churns fast. SaaS marketing metrics break down how to build these cohort views in practice.
| Segment | Annual Churn Target | NRR Target | CAC Payback |
|---|---|---|---|
| Early-stage SaaS | Below 15% | Above 100% | Under 18 months |
| Mid-market SaaS | Below 8% | Above 110% | Under 12 months |
| Professional services | Below 20% | Above 100% | Under 6 months |
These are directional targets, not guarantees. Your actual thresholds depend on ACV, sales cycle length, and gross margin. The churn rate benchmarks guide covers interpretation in more detail.
The decision rule is simple: if your CAC payback period exceeds your average client lifespan, acquisition is destroying value. Fix retention first.
Run through these before reallocating budget:
If you answered yes to two or more, shift budget toward retention before adding acquisition spend.
Small professional-services firm (15 active clients, 30% annual churn): Every churned client requires three new clients to recover the lost LTV. At 30% churn, the firm is replacing nearly a third of its book every year. The fix: structured onboarding, a 30-day review cadence, and a referral incentive program. Acquisition spend holds until churn drops below 20%.
Mid-market SaaS (200 accounts, 12% annual churn, 14-month CAC payback): Churn is near target, but payback is too long. The issue is likely CAC efficiency, not retention. The fix: tighten ICP targeting to reduce wasted sales cycles, and add an expansion motion to lift NRR above 110%. Both moves shorten effective payback without cutting acquisition volume.
Each experiment below follows the same structure: hypothesis, resources needed, primary metric, and pass/fail criteria. Run no more than two in parallel to keep results clean. Isolate cohorts so one experiment doesn’t contaminate another’s data.
Structured onboarding checklist rollout Hypothesis: A documented eight-step onboarding sequence reduces 90-day churn. Resources: CS lead, CRM template, one week of setup. Metric: 90-day retention rate by cohort. Pass: Retention improves versus prior cohort. Structured onboarding materially reduces early client loss, increasing the 90-day retention rate by cohort. As shown in industry guides, firms without structured onboarding lose a significant portion of new clients in the first 90 days; a documented onboarding flow improves this outcome.
Automated payment recovery (dunning) Hypothesis: Automated retry sequences recover involuntary churn from failed payments. Resources: Billing platform with dunning capability (Stripe, Chargebee). Metric: Involuntary churn rate month-over-month. Pass: Measurable reduction in failed-payment cancellations within 60 days.
LinkedIn account-based ad test Hypothesis: Targeted LinkedIn ads to a defined ICP list generate qualified pipeline at a lower CPL than broad campaigns. Resources: $3,000–$5,000 test budget, matched audience list, one landing page. Metric: CPL and pipeline-to-close rate versus control. Pass: CPL below current blended average with comparable close rate.
Referral incentive pilot Hypothesis: A structured referral incentive increases inbound referrals from existing clients. Resources: Incentive design (credit, gift, or cash), email sequence, tracking link. Metric: Referral-sourced leads per month. Pass: At least two qualified referral introductions within 90 days.
Health-score-based outreach campaign Hypothesis: Proactive outreach to at-risk accounts (health score below threshold) reduces churn in that segment. Resources: Health scoring model, CS playbook for at-risk accounts, two hours per week of CS time. Metric: Churn rate among at-risk cohort versus prior period. Pass: Churn in at-risk segment drops by any measurable amount.
Intake form UX update Hypothesis: Shortening the intake form to essentials and sending it within 72 hours of contract signature increases completion rates. Resources: Form redesign (one day), updated send trigger in CRM. Metric: Intake form completion rate. Pass: Completion rate above 80% within 30 days.
Keep each experiment to a 90-day window with a single primary metric. Secondary metrics are fine to track, but don’t let them drive the pass/fail decision. Proven growth tactics for B2B SaaS cover additional experiment frameworks worth running after these six.
Retention delivers higher ROI than acquisition in most B2B SaaS and professional services businesses. Fix churn and onboarding first, then scale acquisition into a healthy base.
| Point | Details |
|---|---|
| Retention before acquisition | Prioritize retention if annual churn exceeds your segment’s target or CAC payback exceeds 12 months. |
| Onboarding drives early retention | A structured eight-step onboarding sequence reduces 90-day client loss and sets the tone for expansion. Firms without structured onboarding lose a significant portion of new clients in the first 90 days, but a documented onboarding flow measurably improves early retention. |
| Track LTV, CAC, and NRR together | No single metric tells the full story; LTV:CAC above 3:1 and NRR above 100% are the core targets. |
| Run 90-day experiments | Isolate cohorts, pick one primary metric per test, and run no more than two experiments in parallel. |
| Bigmoves for execution | Bigmoves designs onboarding systems, customer success playbooks, and CAC optimization programs for B2B SaaS and technology firms. |
Most growth teams treat acquisition and retention as parallel tracks with equal priority. They’re not. Acquisition without retention is a math problem you can’t win.
The teams I see struggle most are the ones who scale paid acquisition before their onboarding is repeatable. They hit a CAC payback of 18 months, wonder why the business feels expensive to grow, and then add more acquisition budget to compensate. The real fix is almost always upstream: a broken handoff, an intake form nobody completes, a kickoff call with no 30-day review scheduled.
The counterintuitive truth is that fixing retention makes acquisition cheaper. When NRR is above 110%, you need fewer new clients to hit the same growth target. When referrals come from satisfied long-term clients, your CPL drops. When onboarding is tight, sales can promise a specific experience and deliver it, which shortens sales cycles.
The 90-day experiments in this guide are designed for exactly this: small, measurable tests that prove the retention lever before you commit budget. Start with onboarding. It’s the highest-leverage fix in most B2B businesses, and it costs almost nothing to improve.
Most B2B SaaS and technology companies know their churn is too high or their CAC payback is too long. The harder part is knowing which lever to pull first and building the operational systems to make it stick.
Bigmoves works with founders, CMOs, and growth teams at mid-market and scaling SaaS companies to design the systems that fix both sides of the equation. That includes structured onboarding sequences and customer success playbooks, CAC optimization through tighter ICP targeting and channel pilots, positioning and website deployment built for conversion, and demand generation across LinkedIn, Google Ads, email, and webinars. The goal is a shorter CAC payback, lower churn, and an expansion motion that makes NRR above 100% the default.
Led by Veb, with 17 years of B2B and SaaS experience across 75+ clients, Bigmoves delivers project-based and fractional CMO engagements scoped to your stage and goals. If your acquisition and retention numbers aren’t where they need to be, contact Bigmoves to talk through where to start.
The research and frameworks in this guide draw from the following sources. Each is annotated for what it covers and where it appears in the article.
Why Client Retention Beats Client Acquisition (The Math) — Pharallax AI: Five-year modeled scenario showing retention-focused investment outperforming acquisition by approximately 2.4x. Used in the retention ROI section and the benchmark discussion.
The Complete Guide to Client Onboarding 2026 — OnboardMap: Covers structured onboarding as a driver of early retention. Used in the retention playbook and the 90-day onboarding experiment.
Customer Retention Strategies That Get Results — Salesforce: Source for the 84% loyalty program repeat-purchase figure and personalization as a retention driver. Used in the retention strategies section.
Customer Retention Strategies That Actually Work — Gray Group Intl: Covers the 5–25x acquisition cost differential versus retention and the case for automated payment recovery. Used in the retention ROI and experiments sections.
New Client Onboarding Done Right — Moxo: Details the eight-step onboarding flow used in the retention playbook and the 90-day onboarding experiment template.
Customer Retention Versus Customer Acquisition — Forbes: Frames acquisition as finding right-fit customers and retention as fixing friction. Used in the definitions section and acquisition strategies.
Client Onboarding Process Flow: Complete Guide — Assembly: Covers how a documented onboarding flow reduces scope disputes and builds client confidence. Supports the handoff and onboarding sections.
The Value of Keeping the Right Customers — HBR: Harvard Business Review’s foundational piece on retention economics. Background for the retention ROI argument and the LTV compounding discussion.
Acquisition covers attracting and converting net-new clients. Retention covers keeping existing clients active and renewing. Both are necessary, but they have different costs, metrics, and owners.
A SaaS company runs LinkedIn ads to acquire right-fit accounts (acquisition), then uses a structured onboarding sequence and health scoring to keep them past the 90-day churn window (retention). The result is a shorter CAC payback and NRR above 100%.
In most B2B businesses, roughly 80% of revenue comes from 20% of clients. The practical implication: identify your highest-value accounts and give them a disproportionate share of your customer success resources and expansion attention.
Prioritize retention when annual churn exceeds your segment’s target, your LTV:CAC ratio is below 3:1, or your CAC payback period is longer than 12 months for SaaS or 6 months for professional services.
Effective onboarding delivers a defined “first value” moment within 30 days, uses specific document requests rather than category-based asks, and schedules the 30-day review during the kickoff call. Structured onboarding materially reduces early client loss, increasing the 90-day retention rate by cohort. As shown in industry guides, firms without structured onboarding lose a significant portion of new clients in the first 90 days; a documented onboarding flow improves this outcome.



%20-%20white.svg)