%20png%20copy.avif)

Most founders treat their churn rate like a final grade on a report card. A low number feels like an A+, a high one signals failure.
This is a dangerous oversimplification. Your headline churn number—the one you report to the board—is often the most misleading metric in your company. It creates a false sense of security while hiding fatal flaws in your G-to-Market strategy and business model.
Real insight doesn't come from celebrating that number. It comes from dissecting it.
The obsession with a single, blended churn rate is a hangover from a simpler SaaS era. Today, it’s mostly a vanity metric.
I’ve seen early-stage companies with a "healthy" 4% customer churn hemorrhage their highest-value accounts, effectively bleeding out their revenue base while acquiring low-value, high-maintenance users. They were celebrating a number that pointed directly toward insolvency.
The core problem? Not all churn is created equal. Your churn rate alone tells you nothing about who is leaving or how much revenue is walking out the door with them. This distinction is the critical first step in building a retention strategy that actually works.
You must track two types of churn. They often tell completely different stories about your business health.
The first is Customer Churn, or Logo Churn. This is the simple count: the percentage of customers who cancel their subscriptions. It’s a measure of volume.
The second, and far more important, is Revenue Churn (MRR/ARR Churn). This measures the percentage of recurring revenue lost from those cancellations. This is a measure of value.
A low customer churn rate feels like a win. But if the few customers who left were your largest enterprise accounts, your revenue churn could be catastrophic. Conversely, you could have high customer churn among your smallest, self-serve accounts, yet maintain healthy—or even negative—revenue churn if your larger accounts are stable and expanding.
This isn't theoretical. The B2B SaaS industry saw this divergence play out at scale. Macroeconomic pressures in 2023 forced a spike in cancellations, with median customer churn for startups jumping to 20.43%.
However, revenue churn settled at a much lower 15.17%. This shows that while more companies cut software, the revenue impact wasn't proportional. Why? Higher-value, more resilient accounts were better retained. You can find more of these B2B SaaS startup benchmarking insights and their implications.
The difference between tracking logos and tracking revenue isn’t subtle—it’s the difference between a surface-level snapshot and a true diagnostic of your business. Founders must monitor both.
Tracking both prevents you from optimizing for the wrong outcome. You might pour resources into saving 10 small customers when the same effort could have saved one enterprise account worth 50 times more.
The most common strategic error is optimizing for logo retention at the expense of revenue retention. You end up building a product and a customer success motion for your noisiest, lowest-ACV customers while your ideal, high-LTV customers silently attrit.
Benchmarks are diagnostic tools, not targets. Your goal isn't to hit an arbitrary 5% churn rate. It's to understand the reality of your business—which customers are leaving, why, and the financial impact.
Only then can you move from reporting on churn to strategically managing it. Without this clarity, you're flying blind.
Let’s be direct: generic industry benchmarks are dangerous. Quoting an “acceptable” 5-7% annual churn rate is the kind of advice that gets founders into serious trouble. It's a meaningless average that ignores the physics of your business.
A 5% churn rate might be world-class for a high-ACV enterprise product sold on multi-year contracts. For a low-ACV, product-led growth tool targeting SMBs, that same 5% monthly churn is a death sentence. Your business model dictates your churn tolerance—not some random blog post.
You need benchmarks that reflect your reality. The only numbers that matter are segmented by the variables that drive retention: company stage, revenue scale, customer size, and go-to-market motion. Everything else is noise.
This chart from a recent industry analysis perfectly illustrates the disconnect. It shows a massive gap between the number of customers who churned versus the actual revenue impact.
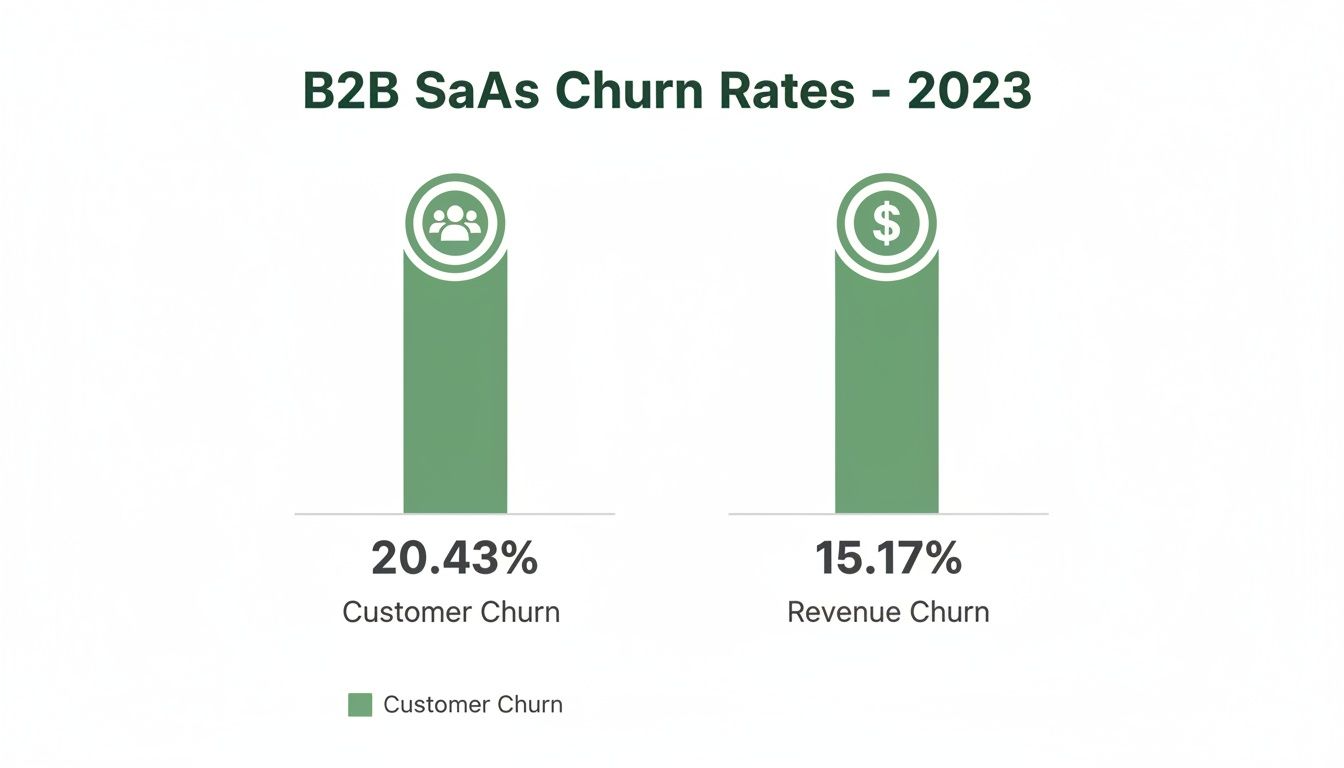
The real story here is that while many customers left (20.43% logo churn), the revenue impact was significantly lower (15.17%). This is a classic sign that lower-value, non-ideal customers were churning at a much higher rate than the strategic accounts you actually want to keep.
Let's move past simplistic averages and look at benchmarks through a strategic lens. Context is everything.
The most common mistake is comparing a PLG churn rate to an enterprise sales-led benchmark. You're not playing the same game. Your model is built for volume and relies on net revenue retention from successful users to offset the high churn from transient ones.
To make this actionable, let’s examine specific data. While the average annual churn for mature SaaS companies is often 5-7%, that figure hides the most important part of the story for growth-stage companies.
For instance, high-growth companies in the $1 million to $30 million ARR range saw a median annual net revenue churn of negative 18.5% in 2023. They grew revenue from their existing customer base faster than they lost it. The top quartile in this segment achieved a 50% growth rate from existing customers alone.
However, churn varies wildly by vertical. SaaS tools for Marketing and Sales teams experience a median customer churn of 28%, substantially higher than the overall benchmark. Why? These markets are crowded, switching costs can be lower, and budget scrutiny is intense. These contextual factors are critical.
This framework is more useful for evaluating performance against true peers. It moves beyond a single, misleading number to a realistic yardstick based on your business profile.
Use these benchmarks not as a pass/fail grade, but as a diagnostic tool. If your numbers are out of line, it’s not a moral failure—it’s a signal to investigate a specific part of your business. It could be a flaw in positioning, a weakness in onboarding, or a mismatch between your product and the customers your sales team is acquiring. Understanding these underlying mechanics is crucial and ties into the broader set of SaaS marketing metrics every founder should know.
Knowing your churn rate is reporting. Understanding why and when customers leave is strategy.
Too many founders stare at a dashboard, watching a number tick up, completely paralyzed. They see "churn" as one big, scary monster, when it’s almost always a symptom of several smaller, fixable problems.
A vague "churn problem" is impossible to solve. You have to break it down. Is it a botched onboarding experience? A pricing mismatch? A missing feature that creates a dead end for a specific user type? A single, blended churn rate will never give you those answers.
This is where most teams stumble. They react to the overall number instead of digging into the variables that drive it. The goal isn't to build a prettier dashboard; it's to build a diagnostic engine.
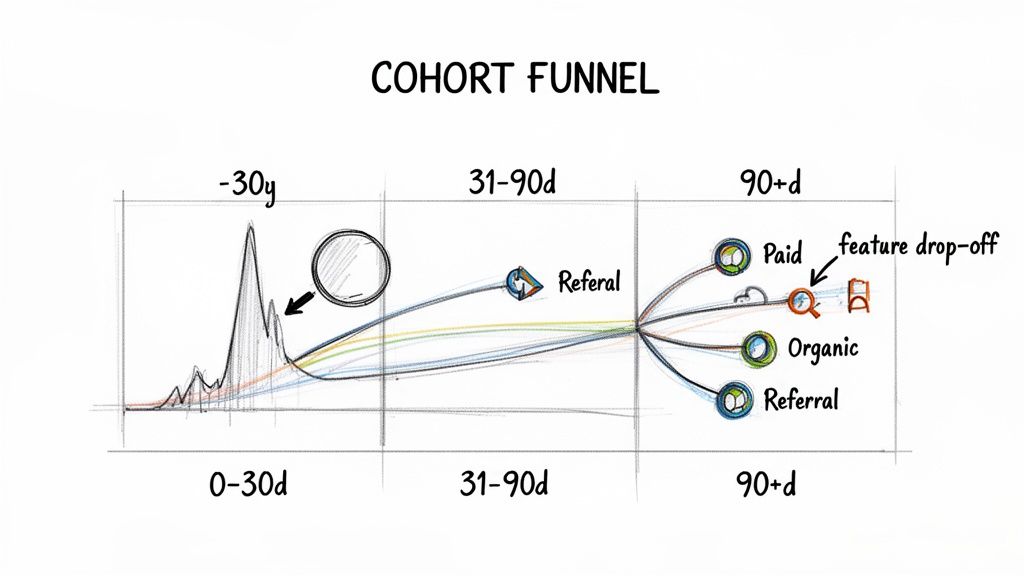
The most powerful diagnostic tool is cohort analysis. It’s how you stop seeing your customer base as one giant blob and start grouping them by shared characteristics. This is where you uncover the hidden patterns driving people away.
Your headline churn rate is an average of averages. It mashes together the behavior of your die-hard fans, your biggest detractors, and everyone in between. Averages hide the truth. Cohorts reveal it.
Instead of asking, "What's our churn rate?" you need to ask sharper questions. Cohort analysis is the framework that gets you those answers.
For any B2B SaaS company, three non-negotiable cohort analyses will take you from reporting numbers to making diagnoses. These should be the bedrock of your retention strategy.
Time-Based Cohorts: What is our Day 30 churn?
This is the first, most fundamental cohort. Group customers by their sign-up month and track their retention. The most critical metric is first-month churn. High churn in the first 30-60 days is a massive red flag. The problem isn't long-term value; it’s your initial promise, onboarding, or activation. You're failing to deliver on the value you sold them on day one.
Segment-Based Cohorts: Is churn concentrated in a specific ICP?
Next, slice your customer base by the firmographics that define your ideal customer profile—company size, industry, user role. I once worked with a company that discovered 80% of their churn came from a single, high-maintenance SMB segment. The sales team loved them because of short sales cycles, but the data proved these customers were profoundly unprofitable. This analysis forces hard conversations about who you're selling to.
Behavioral Cohorts: Is a failed feature adoption driving users away?
This is where you group users by the actions they take—or don't take—in their first few weeks. Compare the churn rate of users who set up a key integration versus those who don't. If the churn for non-integrated users is 5x higher, you haven’t just found a correlation; you've found a direct, actionable lever to pull. This is how you tie product engagement directly to revenue retention.
Your goal is to find the story behind the numbers. A high churn rate for the "January Cohort" acquired through "paid social" that "never adopted Feature X" is a specific, solvable problem. A blended 5% monthly churn rate is just a number.
Making this shift—from a single metric to a series of diagnostic questions—is the most important thing a leadership team can do. It transforms the churn conversation from frustration to focused, surgical action.
Once you understand the specifics, you can align your product, marketing, and success teams around a common goal. For a deeper look at the metrics that fuel this process, check our guide to essential customer success metrics and their strategic implications.
The era of growth-at-all-costs is over.
For years, cheap capital papered over serious retention issues, letting companies mask high churn with even higher acquisition spend. That game has ended. In today’s market, retention isn’t just important—it’s the only viable growth engine.
This isn’t a cyclical downturn; it’s a fundamental shift in how B2B customers buy software. Every budget is under a microscope. Every renewal demands a clear ROI. High churn is no longer a leaky bucket you can out-fill—it’s a hole in the hull that will sink the ship.
Founders who don’t internalize this new reality are operating with an outdated playbook. The strategies that worked in a bull market are now liabilities.
The market whiplash of the last few years has brutally exposed the fragility of many SaaS business models. After a period of stability, B2B churn reversed course as economic conditions tightened.
One market report revealed that after hovering around 15% annually, industry-wide MRR churn hit an all-time high in December 2023. That figure represents a 25% increase compared to December 2021. This Q4 spike, driven by ruthless enterprise cost-cutting, is now a predictable headwind.
The reason is simple: compound annual growth rates for SaaS collapsed from a peak of 60% in early 2022 to just 8% by August 2023. This forced even well-capitalized companies to prioritize efficiency over expansion. You can read the full analysis on the B2B SaaS market to get the whole picture.
This data isn't just an interesting trend; it's a mandate for a new playbook. Your customers are consolidating their tech stacks, and every tool is on the chopping block. Only indispensable products will survive.
The top-quartile companies aren't just weathering this storm; they're forging more resilient, efficient growth models. They’ve stopped reacting to churn and started proactively redesigning their operation around retention. Their new playbook is built on three pillars.
The old playbook treated retention as a feature of customer service. The new playbook understands that retention is the output of your entire go-to-market strategy—from positioning and sales to product and pricing.
This isn’t about incremental improvements. It’s about a complete strategic realignment.
The companies that make these shifts will emerge stronger, with a more durable revenue base and a massive competitive advantage. Those that cling to the old model will fight an unwinnable war of attrition. For a more detailed breakdown, our guide to effective SaaS customer retention strategies provides an actionable framework.
Don't think of churn analysis as a look in the rearview mirror. It's an intelligence report on the health of your go-to-market strategy. If you're just handing churn benchmarks to the finance team for monthly reports, you're missing the point. Churn is the most direct, unfiltered feedback loop on your positioning, sales motion, and marketing effectiveness.
Founders often draw a dangerous line in the sand: Marketing gets customers, Sales closes them, and Customer Success keeps them. This siloed thinking is a classic recipe for a stalled-out GTM engine. The truth is, your churn data is the ultimate source of truth, showing you exactly where the handoffs are fumbling and where the initial promise made by your team fails to deliver long-term value.
The most common GTM mistake? Defining your Ideal Customer Profile (ICP) based on who's easiest to sign up. Teams get addicted to chasing the segments that are fastest to attract and quickest to close. This is how you build a high-churn business, one "easy" deal at a time.
Your cohort analysis is the map to a better ICP. The question isn't, "Who buys our product?" It's, "Who stays with our product, and why?" The answers will force you to recalibrate where you point your GTM cannons.
Marketing’s Mandate Shifts: The goal can no longer be hitting an MQL target. Marketing's real job is to attract prospects who look just like your lowest-churn, highest-LTV cohorts. This means ditching generic feature-benefit talk and focusing your messaging on the specific, long-term outcomes your best customers achieve.
Sales Qualification Sharpens: Your sales team needs to be armed with retention data. They must understand that a "quick win" with a customer who doesn't fit the ICP is a net loss for the company. Use your churn insights to build clear disqualification criteria into the sales process, empowering your reps to walk away from deals destined to fail.
Your churn data is the most objective performance review your GTM strategy will ever receive. High churn isn't a customer success problem; it's a company-wide strategy problem that almost always starts with a flawed ICP.
When Sales and Marketing are out of sync, churn is the consequence. Marketing casts a wide net with a broad promise, and Sales closes deals by setting expectations that are impossible to meet. Customer Success is left holding the bag.
Putting churn insights to work forces these teams to get on the same page.
For Sales Teams
The sales process must change. It's not about closing a contract; it's about kicking off a successful partnership.
For Marketing Teams
Marketing needs to shift from a feature-first to a value-first story.
Ultimately, using saas churn rate benchmarks to shape your strategy is about building a GTM engine that acquires the right customers, not just more customers. It’s a fundamental move from a volume-based mindset to a value-based one. This approach is central to winning in modern B2B SaaS marketing, where efficient, sustainable growth is the only game that matters.
Your current dashboard is lying to you. By the time MRR churn appears in your monthly report, the damage is done. You’re looking at a lagging indicator—an autopsy report for revenue that’s already gone.
The best operators don't watch churn; they get ahead of it. They build an early warning system based on the leading indicators of customer health. These are the subtle behavioral shifts that appear weeks or months before a cancellation request hits an inbox.
This is about moving from a reactive, fire-fighting mode to a proactive, revenue-saving one.
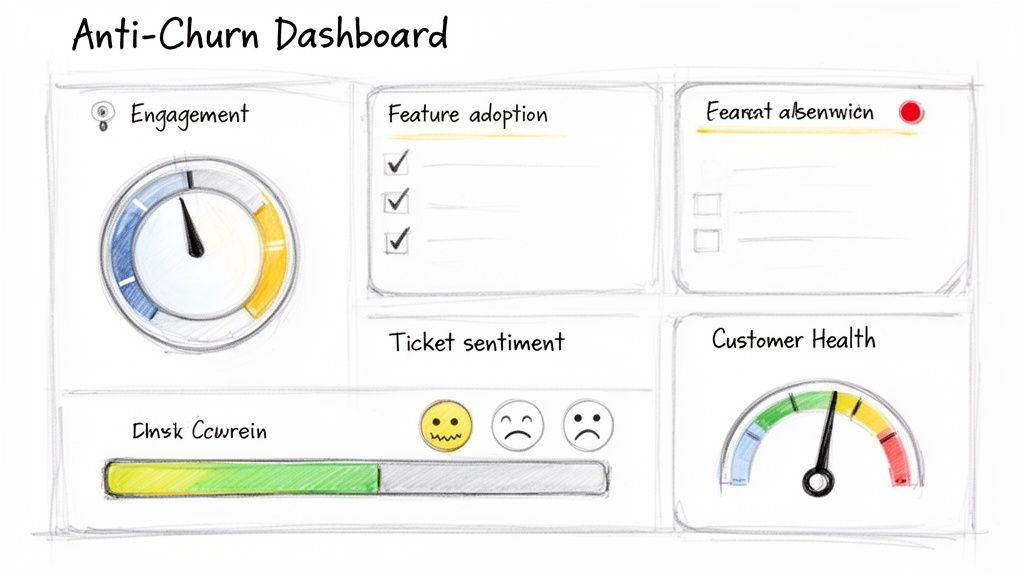
Most churn dashboards are useless for proactive management because they track outcomes, not causes. A true anti-churn dashboard must measure the precursors to churn, giving your teams the signal to intervene when it still makes a difference.
This isn’t about building a more complicated spreadsheet. It’s about tracking the vital signs of your customer base.
Stop celebrating your low MRR churn rate and start obsessing over your high percentage of 'at-risk' yellow accounts. The first is history; the second is your future.
Data is useless without action. Your anti-churn system must be wired directly into your customer success and product team workflows. A red health score shouldn't just be a number on a dashboard; it should automatically trigger a pre-defined playbook.
This could mean a proactive check-in from a CSM, an automated email campaign offering targeted training, or an alert to the product team that a high-value account is struggling.
This is the real work of retention. It’s not about sending "please don't go" emails after a customer has canceled. It’s about building a system that makes cancellation feel illogical because you’ve consistently proven your value long before the renewal date is on the calendar.
This is the most common question, and the honest answer is: it depends entirely on who you sell to. There is no magic number.
A healthy churn rate is a moving target, dictated by your business model, ACV, and customer segment. For a high-touch enterprise product, an annual churn of 5-7% is strong. But for a PLG or SMB-focused business, a 3-5% monthly churn rate might be acceptable, especially with strong net revenue retention to balance it.
Think of benchmarks as a diagnostic tool, not a report card.
For nearly every B2B SaaS company I've worked with, a monthly and quarterly cadence is standard.
Calculating churn monthly gives you an almost immediate feedback loop. Did that new feature or pricing change have an impact? Monthly numbers will tell you. Quarterly analysis helps you spot broader trends without getting whiplashed by short-term noise.
Annual churn rates are your 30,000-foot view—perfect for board meetings and strategic planning.
Track both, but if you can only focus on one, make it revenue churn. It paints a more accurate picture of your company’s financial health.
Customer churn is misleading. Losing ten small customers on your lowest-tier plan has a completely different business impact than losing one major enterprise account that makes up 15% of your MRR. Prioritize reducing revenue churn. It’s the metric that directly impacts your runway, valuation, and ability to grow.
At Big Moves Marketing, we help B2B SaaS founders move beyond surface-level metrics to build a GTM strategy that attracts, closes, and retains the right customers. We provide the strategic clarity needed to connect churn insights directly to your positioning and sales motion, creating a more resilient growth engine.
Find out how we can help you build a more durable GTM strategy.
Explore Big Moves Marketing services and resources:
June 26, 2026


%20-%20white.svg)