%20png%20copy.avif)

Multi-touch attribution assigns fractional credit to every marketing touchpoint a buyer hits before converting, instead of crediting just one. It gives B2B teams a clearer read on what actually moves pipeline than single-touch models ever could.
Here’s the one-line rule: if you have a marketing operations resource, clean UTM tracking, and at least a few hundred monthly leads, pilot multi-touch attribution (MTA) now. If your data is scattered across three disconnected tools and nobody owns your CRM hygiene, fix that first.
Three moves to make this week:
The sections ahead cover model types, a step-by-step build, validation methods, and where MTA hits its limits.
Multi-touch attribution works when clean tracking, identity resolution, and incrementality testing back up the model, not when the model runs alone.
| Point | Details |
|---|---|
| Start with a simple model | Use linear or U-shaped before moving to algorithmic models that need high conversion volume. |
| Fix identity before modeling | Contact-to-account linking prevents B2B committee deals from undercounting influence. |
| Validate with holdout tests | Attribution shows correlation only; incrementality testing confirms which channels cause conversions. |
| Pair MTA with MMM | Use MMM for offline and aggregate effects, MTA for channel-level digital optimization. |
| Pilot before scaling | Bigmoves scopes six to twelve week MTA pilots with instrumentation, CRM mapping, and incrementality testing built in. |
Every MTA model answers the same question differently: which touchpoints deserve credit, and how much? Adobe’s breakdown covers the common families, and each one carries a distinct bias.
Linear splits credit evenly across every touchpoint in the journey. Use it when you want quick visibility into which channels show up at all, before you start weighting anything.
Time-decay gives more credit to touchpoints closer to conversion. Use it when your sales cycle is short and late-funnel activity (demos, pricing page visits) tends to predict close rate.
Position-based (U-shaped) weights first and last touch heavily, splitting the rest thin. This fits teams who care most about how leads enter the funnel and what finally converts them.
W-shaped adds a third weighted point: the moment a lead becomes a marketing qualified lead. B2B teams with a defined MQL stage often prefer this because it credits the middle of the funnel, not just the ends.
Full-path extends W-shaped further, adding weight at the opportunity-creation stage. It suits longer B2B cycles where deals pass through multiple internal milestones before close.
Algorithmic (data-driven) models use machine learning to assign credit based on actual conversion patterns in your own data, rather than a fixed rule. This is the most accurate option on paper, but it needs volume. Below a few thousand conversions a year, the model has too little signal to trust.
Custom models let you hand-weight touchpoints based on internal judgment. Some vendors call this “position-based custom” or a “hybrid” model.
Pro Tip: Don’t jump to an algorithmic model just because it sounds more advanced. If your pipeline runs a few hundred deals a year, a well-chosen rule-based model will out-perform an under-fed algorithm every time.
Building MTA isn’t a single project. It’s six connected phases, and skipping one usually means redoing another later.
Set goals and KPIs first. Decide whether you’re optimizing for revenue, pipeline, sales-qualified leads, or trial starts. Get sales and finance to agree on the definition before a single line of tracking code goes live.
Build a data collection checklist. This means consistent UTM parameters across every campaign, tracking pixels on key pages, a documented event taxonomy (so “form submit” means the same thing everywhere), server-side capture where cookies fail, call tracking for sales-assisted deals, and clean CRM field mappings. Twilio’s implementation guide treats this instrumentation layer as the foundation everything else sits on, and that’s accurate. Skip it and your model runs on garbage.
Solve identity and matching. In B2B, a single deal often involves five or more people from one account. You need contact-to-account linking, not just contact-level tracking. Choose deterministic matching (login, email match) where you can, and probabilistic matching (device or behavioral signals) only where deterministic data doesn’t exist.
Select a model and deploy it simply. Start with linear or U-shaped. Add complexity only after you’ve validated that your data pipeline is stable. Teams that start with algorithmic models before their data is clean tend to produce confident-looking numbers that are wrong.
Validate with incrementality testing. This is the step most teams skip, and it’s the one that matters most. Attribution models show correlation, not causation, so a channel that looks important in your MTA report might contribute nothing when you actually remove it. Run a holdout test: pause a channel for a defined group or region, then compare pipeline outcomes against a control group.
Reconcile against your CRM. Your attribution platform’s numbers should roughly match what’s showing up in CRM pipeline reports. If they diverge significantly, the gap is usually a tracking or mapping problem, not a real signal.
Rough timeline: goals and KPI alignment takes one to two weeks. Instrumentation and identity work takes four to eight weeks depending on how messy your current stack is. Initial model deployment takes another two to four weeks. Validation runs alongside the pilot, typically six to twelve weeks total.
Pro Tip: Assign one owner for CRM field mapping before you touch the attribution tool. Most MTA failures trace back to inconsistent lead source fields, not the model itself.

MTA has real blind spots, and pretending otherwise sets up bad decisions later.
Mitigate what you can. Server-side tracking recovers some cookie loss. Strong CRM governance, meaning mandatory fields and regular audits, fixes incompleteness over time. Account-based matching closes some of the cross-contact gap. And a simple “How did you hear about us?” field on your contact forms recovers qualitative signal that no pixel ever will.
On privacy: make sure your consent capture, opt-out handling, and data retention practices meet current obligations under frameworks like the CCPA before you scale tracking. This is a compliance decision your legal counsel should confirm, not a marketing call.
Marketing Mix Modeling (MMM) and MTA answer different questions, and confusing them wastes budget. MMM uses aggregate historical data, often including offline spend like TV, sponsorships, and events, to estimate channel-level impact on revenue over time. MTA tracks individual, addressable digital touchpoints and ties them to specific conversions.
| Dimension | MTA | MMM |
|---|---|---|
| Granularity/actionability | Touchpoint and contact-level, highly actionable for campaign tuning | Channel-level and aggregate, better for budget-level decisions |
| Offline/non-addressable coverage | Weak; misses dark-funnel and offline activity | Strong; built to include TV, print, and events |
| Data scale and identity needs | Requires high-volume tracking and identity resolution | Works with less granular, more aggregated data |
| Timeliness | Near real-time signal | Typically quarterly or slower |
| Cost and complexity | Moderate, scales with tracking sophistication | Higher upfront, needs data science resourcing |
Favor MMM when you’re setting an annual budget across offline and digital channels. Favor MTA when you’re optimizing which digital campaign gets the next dollar. The unified-measurement approach recommends running both and reconciling where they disagree.
MTA isn’t the right tool for every team, and pretending it is wastes budget and credibility.
Skip it, or delay it, if your marketing budget is small enough that a handful of campaigns account for most spend. A spreadsheet will tell you as much as a model in that case. Same goes for businesses where most buying influence happens offline, through field sales or referral networks a pixel can’t see. And if your identity resolution is a mess (multiple CRMs, no contact-to-account linking, duplicate records everywhere), fix that foundation first. A model built on fragmented identity data just produces confident-sounding nonsense.
MTA earns its keep once you have digital-heavy demand generation, several hundred monthly leads, and a marketing team accountable for pipeline, not just leads.
On cost and timeline: a pilot typically runs six to twelve weeks and needs light engineering support for tracking setup. Full enterprise deployment, with a dedicated attribution platform and ongoing model tuning, is a multi-quarter commitment with recurring licensing costs.
Common pitfalls:
A pilot is how you prove the model works before you commit real budget to it.
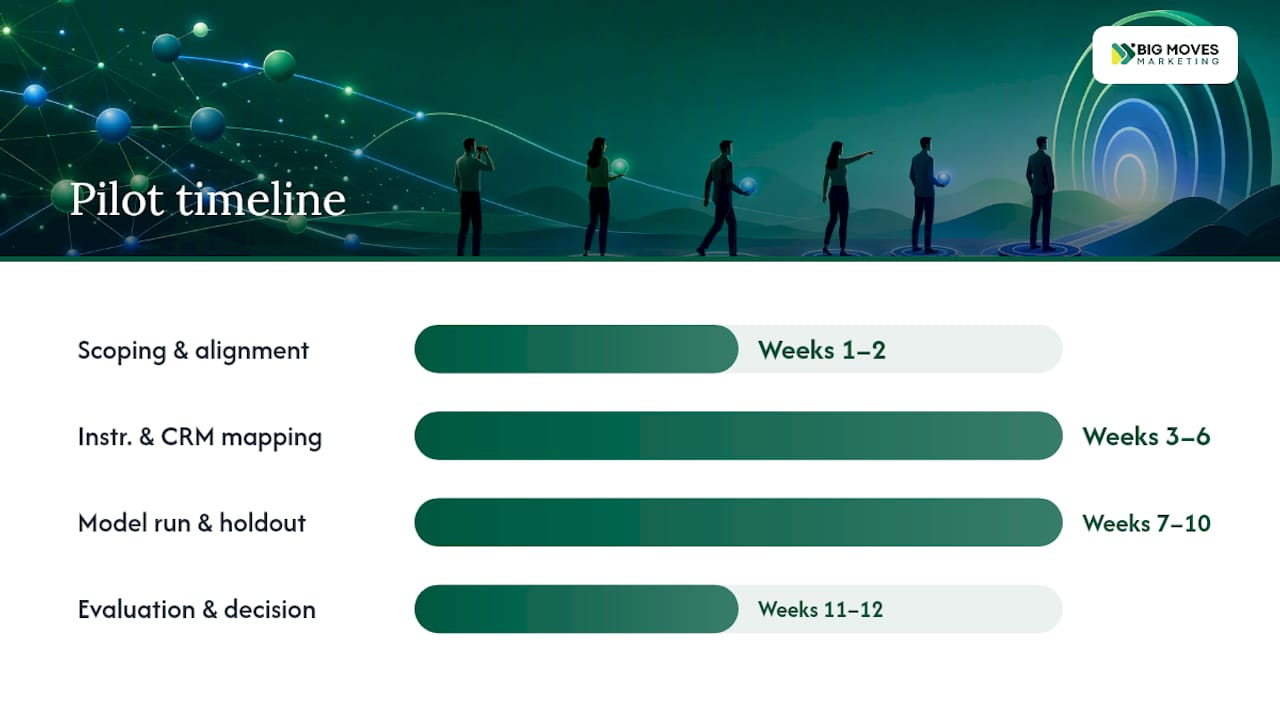
Sample timeline: weeks one and two, scoping and stakeholder alignment. Weeks three through six, instrumentation and CRM mapping. Weeks seven through ten, model runs alongside the holdout test. Weeks eleven and twelve, evaluation and go/no-go decision.
Success looks like a measurable, directional difference between the holdout group and the tracked group, tied to actual pipeline movement, not just report activity. If the numbers reconcile with CRM data and the incrementality test confirms a real lift, expand the program. If they don’t, the B2B-specific guidance on blending MTA with incrementality testing is worth revisiting before you scale further.
Common pitfalls: data gaps from unmapped campaigns, attribution windows that don’t match your actual sales cycle length, and weak contact-to-account linking that undercounts committee-based B2B deals. Fix the mapping and window settings before you blame the model.
Pro Tip: Treat the pilot’s go/no-go decision as binary. If the holdout test shows no measurable lift, don’t expand the program on hope. Fix the instrumentation and run it again.
Build in-house if you already have strong data engineering, a clean CRM, and steady budget to sustain the work quarter after quarter. Hire outside help if you need speed, proper experiment design, or your CRM needs cleanup before any model will produce trustworthy output. A short pilot retainer or a fractional analytics lead paired with your internal ops team usually beats a full internal build for a first attempt.
Running a clean MTA pilot takes instrumentation work, CRM alignment, and incrementality testing design, three things most in-house marketing teams don’t have spare bandwidth for. Bigmoves scopes and runs that pilot for you: tracking setup, CRM field mapping, and a holdout test designed to tell you which channels actually drive pipeline, not just which ones show up in reports.
The result is a pilot report with a prioritized channel list and a clear next-step plan, the kind of evidence a CMO can bring into a budget conversation with confidence. Bigmoves has run multi-channel demand generation programs for SaaS companies before, including work that took one client from zero qualified leads to two hundred, documented in the Sastrify case study. If your marketing site isn’t built to support clean tracking and conversion data in the first place, that’s worth fixing too. Bigmoves builds and launches B2B SaaS websites designed for exactly this kind of measurement from day one. Book an exploratory call to scope your pilot.
It means assigning fractional credit to multiple marketing touchpoints across a buyer’s journey, rather than crediting only the first or last interaction.
Single-touch models give 100% of the credit to one interaction, usually the first or last touch. Multi-touch models distribute credit across every meaningful touchpoint in the journey, giving a fuller picture of what actually influenced the deal.
Define your conversion KPI, instrument consistent tracking across channels, resolve contact-to-account identity, select a starting model like linear or U-shaped, then validate with an incrementality or holdout test before scaling.
MTA tracks individual digital touchpoints tied to specific conversions and works best for campaign-level optimization. MMM uses aggregate data, including offline channels, to guide strategic budget allocation, and the two work best when used together.
Yes. Bigmoves scopes and runs MTA pilots for B2B SaaS teams, covering tracking instrumentation, CRM alignment, and incrementality testing design.





%20-%20white.svg)