%20png%20copy.avif)

Originally published on SaaSTR
Sources: SaaS Capital 2025 Spending Benchmarks Survey (1,000+ companies), Benchmarkit 2025 SaaS Performance Metrics Report, Growth Unhinged 2025 SaaS Benchmarks (800+ companies), Maxio 2025 B2B SaaS Benchmarks Report
An analysis of SaaS Capital's 2025 spending benchmarks and what they mean for your marketing strategy
The latest data from SaaS Capital's survey of over 1,000 private B2B SaaS companies confirms what many of us suspected: even in the age of AI and automation, there's no shortcut to growth. Companies that want to scale are spending significantly on sales and marketing—and that investment isn't declining as they grow.
But buried in the headline numbers (15% of revenue on sales, 10% on marketing) are strategic insights that separate companies capturing market share from those watching competitors pull ahead. This analysis unpacks what the spending data actually means for B2B SaaS marketers and provides a framework for making smarter allocation decisions.
Before diving into strategic implications, let's establish the baseline. According to SaaS Capital's 2025 survey:
Median spending as a percentage of ARR:
Total median spend: 95% of ARR for bootstrapped companies, 107% for equity-backed companies.
Profitability picture: 85% of bootstrapped companies operate within two percentage points of breakeven or profitability. Only 46% of equity-backed companies can say the same.
These numbers provide useful benchmarks, but the real insights emerge when we examine the variations—by growth rate, funding status, and company size.

Here's the finding that should reshape how you think about marketing budgets: companies growing faster than their peers spend significantly more on go-to-market activities.
The data shows:
This correlation raises a critical question: does spending more cause growth, or do growing companies simply have more to spend?
The answer is likely both, but the causality matters less than the strategic implication. If you're targeting aggressive growth, budgeting at median levels probably won't get you there. The companies achieving above-median growth are investing above-median resources in customer acquisition.
What this means for your marketing strategy:
If you're a $5M ARR company targeting 40%+ growth, budgeting 8% of revenue for marketing (the median) positions you for median results. Companies achieving exceptional growth are closer to 11-12%—and that's before accounting for sales investment.
This doesn't mean throwing money at the problem. It means being intentional about the relationship between growth targets and marketing investment. If leadership expects hypergrowth while funding median marketing budgets, something has to give.
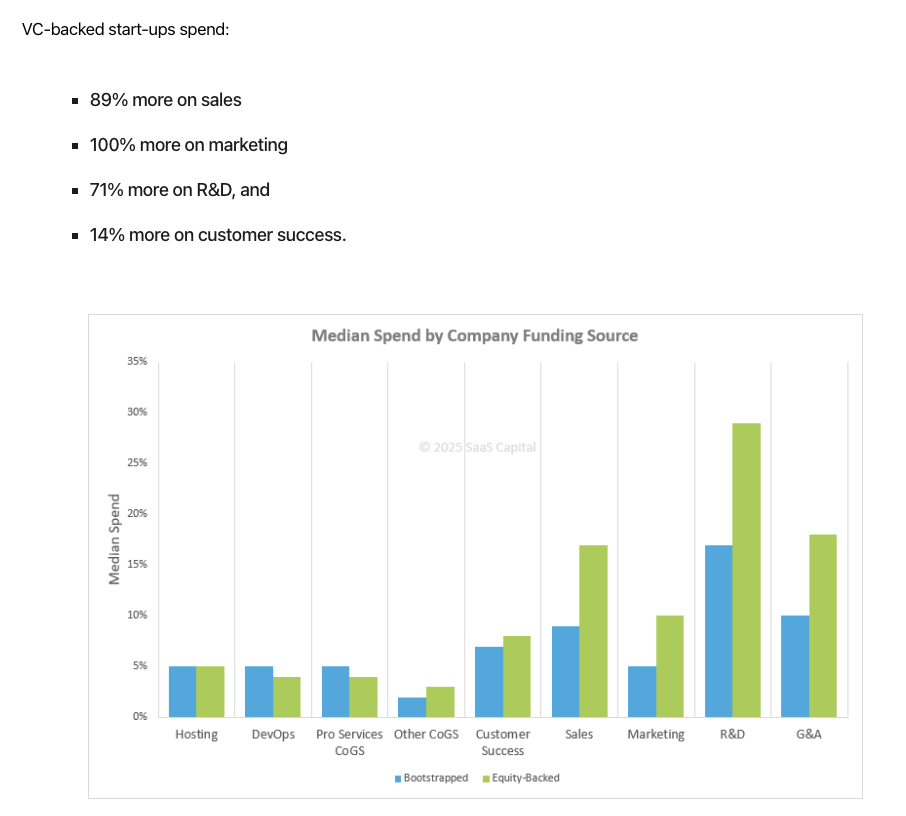
One of the most striking findings from the SaaS Capital data is the magnitude of difference between VC-backed and bootstrapped company spending:
VC-backed companies spend:
That's not a marginal difference. VC-backed companies are investing nearly double in marketing compared to bootstrapped peers.
For bootstrapped companies, this creates a genuine competitive disadvantage in the early stages. You're competing for the same customers with roughly half the go-to-market firepower.
Strategic responses for bootstrapped companies:
The data doesn't mean bootstrapped companies can't compete—85% are profitable or near-breakeven, compared to only 46% of VC-backed companies. But it does mean competing differently:
There's a persistent myth that marketing becomes more efficient at scale—that brand awareness compounds and word-of-mouth reduces the need for paid acquisition. The data tells a different story.
Spending by company size (as % of ARR):
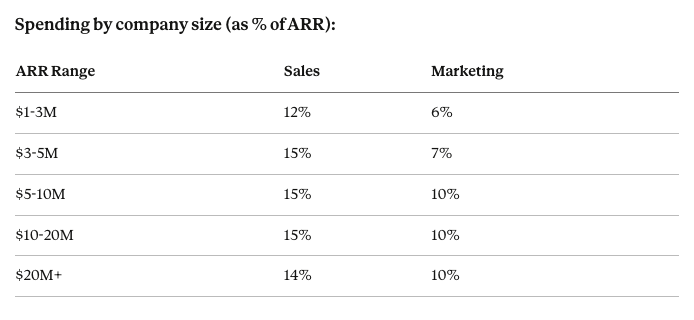
Marketing spend as a percentage of revenue actually increases as companies scale from early stage ($1-3M) to growth stage ($5-20M). It only plateaus—not declines—beyond $20M ARR.
Why doesn't marketing efficiency improve?
Several factors explain this counterintuitive pattern:
What this means for planning:
If you're a $3M ARR company assuming marketing will become more efficient at $10M, you're building on a flawed assumption. Budget planning should assume consistent or increasing marketing investment as a percentage of revenue, not efficiency gains.
This has significant implications for fundraising and financial planning. The path to profitability doesn't run through reduced marketing spend—it runs through improved unit economics (higher LTV, better retention, more efficient conversion) at consistent investment levels.
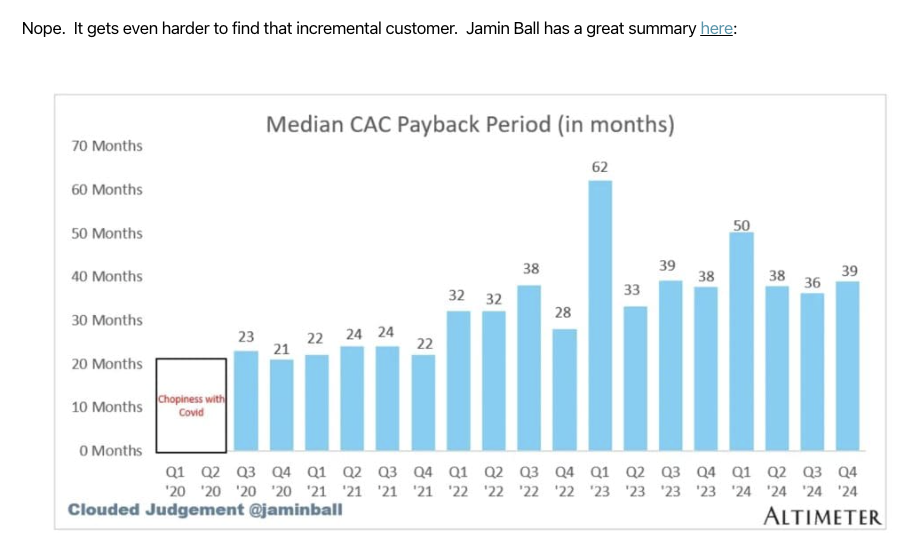
While the SaaS Capital data focuses on spending percentages, complementary research from Benchmarkit, Maxio, and others paints a concerning picture of customer acquisition efficiency.
Key findings from 2025 CAC benchmarks:
This creates a strategic paradox: companies need to spend more on sales and marketing to grow, but each dollar is becoming less efficient.
The efficient growth imperative:
The most successful companies in the current environment combine two metrics that are often analyzed separately: Net Revenue Retention (NRR) and CAC payback period.
According to Kyle Poyar's analysis of 800 B2B SaaS companies:
The gap is enormous. Companies in the top quadrant grow 7x faster than those in the bottom quadrant.
Strategic implications:
One of the less-discussed findings is the significant difference in G&A spending: VC-backed companies spend 80% more on general and administrative costs than bootstrapped peers.
SaaS Capital offers a plausible explanation: the overhead of investor relations. Board meetings, audits, reporting requirements, and the finance infrastructure to support them create real costs that bootstrapped companies avoid.
What this means for marketing leaders:
This isn't directly a marketing issue, but it has budget implications. Every dollar spent on G&A overhead is a dollar not available for customer acquisition. Bootstrapped companies may have smaller total budgets, but a higher percentage of their spending goes directly to growth activities.
For marketing leaders at VC-backed companies, this is worth understanding when negotiating budgets. The "we have more resources" argument needs nuance—some of those resources are absorbed by the infrastructure required to manage those resources.
If there's a silver lining for private companies, it's this: going public doesn't solve the efficiency problem. In fact, public B2B SaaS companies generally have higher customer acquisition costs than startups.
Jamin Ball's analysis of public cloud companies shows no improvement in sales and marketing efficiency at scale. If anything, the largest companies face the steepest efficiency challenges.
Why does efficiency decline at scale?
Strategic implication:
Don't benchmark your marketing efficiency against public company standards assuming they represent best-in-class operations. Private companies often achieve better unit economics precisely because resource constraints force efficiency.
Based on the SaaS Capital data, a reasonable starting point for marketing budget planning is:
But these are guideposts, not rules. Several factors should influence your specific allocation:
Factors that justify higher marketing investment:
Factors that justify lower marketing investment:
Rather than simply adopting industry benchmarks, use them as inputs to a more strategic budgeting process:
Step 1: Define your growth archetype
Are you optimizing for:
Each archetype implies different marketing investment levels relative to benchmarks.
Step 2: Assess your competitive position
Market leaders can sometimes spend less efficiently because brand drives consideration. Challengers often need to outspend to gain share.
Step 3: Evaluate channel efficiency
Where are your current marketing dollars most productive?
Benchmarks assume average efficiency. If your specific channels are performing above average, you may be able to grow faster at lower investment levels—or justify increased investment in what's working.
Step 4: Align with sales capacity
Marketing budgets need to match sales capacity to convert demand into revenue. The best marketing in the world is wasted if generated leads can't be worked effectively.
Step 5: Build in experimentation budget
Best-in-class marketing organizations allocate 10-20% of budget to testing new channels, tactics, and approaches. This prevents over-optimization for current performance at the expense of discovering more efficient approaches.
The SaaS Capital spending benchmarks confirm several truths that should inform B2B SaaS marketing strategy:
The companies that will thrive in the current environment aren't those spending the most or the least on marketing. They're the ones making strategic, data-informed decisions about where and how much to invest—and building the measurement infrastructure to know whether those decisions are working.
If you're at a bootstrapped company:
If you're at a VC-backed company:
If you're planning marketing budgets:
If you're measuring marketing performance:
The data is clear: strategic marketing investment remains essential for B2B SaaS growth. The question isn't whether to invest, but how to invest wisely in an environment where efficiency is increasingly difficult and increasingly important.
One question the SaaS Capital data doesn't directly answer is how AI is affecting these spending patterns. Based on complementary research and market observation, several trends are emerging:
AI isn't reducing marketing spend—it's changing where it goes.
Despite promises of automation-driven efficiency, the data shows marketing spending as a percentage of revenue remains stable or increasing. What's changing is the allocation within marketing budgets:
The AI-native advantage is real but narrow.
Companies founded after ChatGPT's release (late 2022) show different characteristics than traditional B2B SaaS:
However, it's too early to know whether these advantages persist at scale or whether AI-native companies will face the same efficiency challenges as they mature.
Strategic implication:
Don't assume AI will fundamentally change the marketing investment requirements for growth. The companies achieving efficient growth with AI are typically using it to do more with their existing budgets—not to achieve the same results with smaller budgets. Plan accordingly.
For marketing leaders who need to advocate for appropriate budget levels, the SaaS Capital data provides valuable ammunition. Here's how to use it:
When leadership questions marketing spend levels:
"Our marketing budget at 8% of ARR is below the industry median of 10%, and significantly below the 12-15% that high-growth companies invest. If we're targeting growth rates above median, we need to consider whether our marketing investment supports that ambition."
When comparing to VC-backed competitors:
"Our VC-backed competitors are investing approximately twice what we are in marketing. We can compete effectively by being more efficient and focused, but we should be realistic about the resource disadvantage and prioritize accordingly."
When budgets are being cut:
"The data shows that marketing spend as a percentage of revenue doesn't decline as companies scale—if anything, it increases from 6% at early stage to 10% at growth stage. Cutting marketing budget now may create short-term savings but will likely require reinvestment later to restart growth."
When CAC is rising:
"Rising CAC is an industry-wide trend, with new customer acquisition costs increasing 14% year-over-year across B2B SaaS. Our focus should be on relative efficiency compared to peers, not absolute improvement against historical benchmarks."
The most striking insight from the SaaS Capital data is what economists might call a spending paradox: the companies that achieve the best outcomes are often those that spend more, not less, on customer acquisition.
This runs counter to the efficiency narrative that has dominated B2B SaaS discourse since 2022. Yes, efficient growth matters. Yes, unit economics must work. But efficiency alone doesn't create growth—it creates profitable stagnation.
The companies navigating this paradox successfully share common characteristics:
The benchmark data won't tell you exactly how much to spend. But it should inform how you think about the relationship between investment and growth—and help you make the case for appropriate resources to achieve your goals.
Sources: SaaS Capital 2025 Spending Benchmarks Survey (1,000+ companies), Benchmarkit 2025 SaaS Performance Metrics Report, Growth Unhinged 2025 SaaS Benchmarks (800+ companies), Maxio 2025 B2B SaaS Benchmarks Report
Explore Big Moves Marketing services and resources:
June 26, 2026


%20-%20white.svg)